The new Harmison? Or is it the new Caddick?
Like the other two tall England fast bowlers, Stuart Broad has been destructive when at his best, but in between those spells his bowling average is unusually high
S Rajesh
24-May-2013
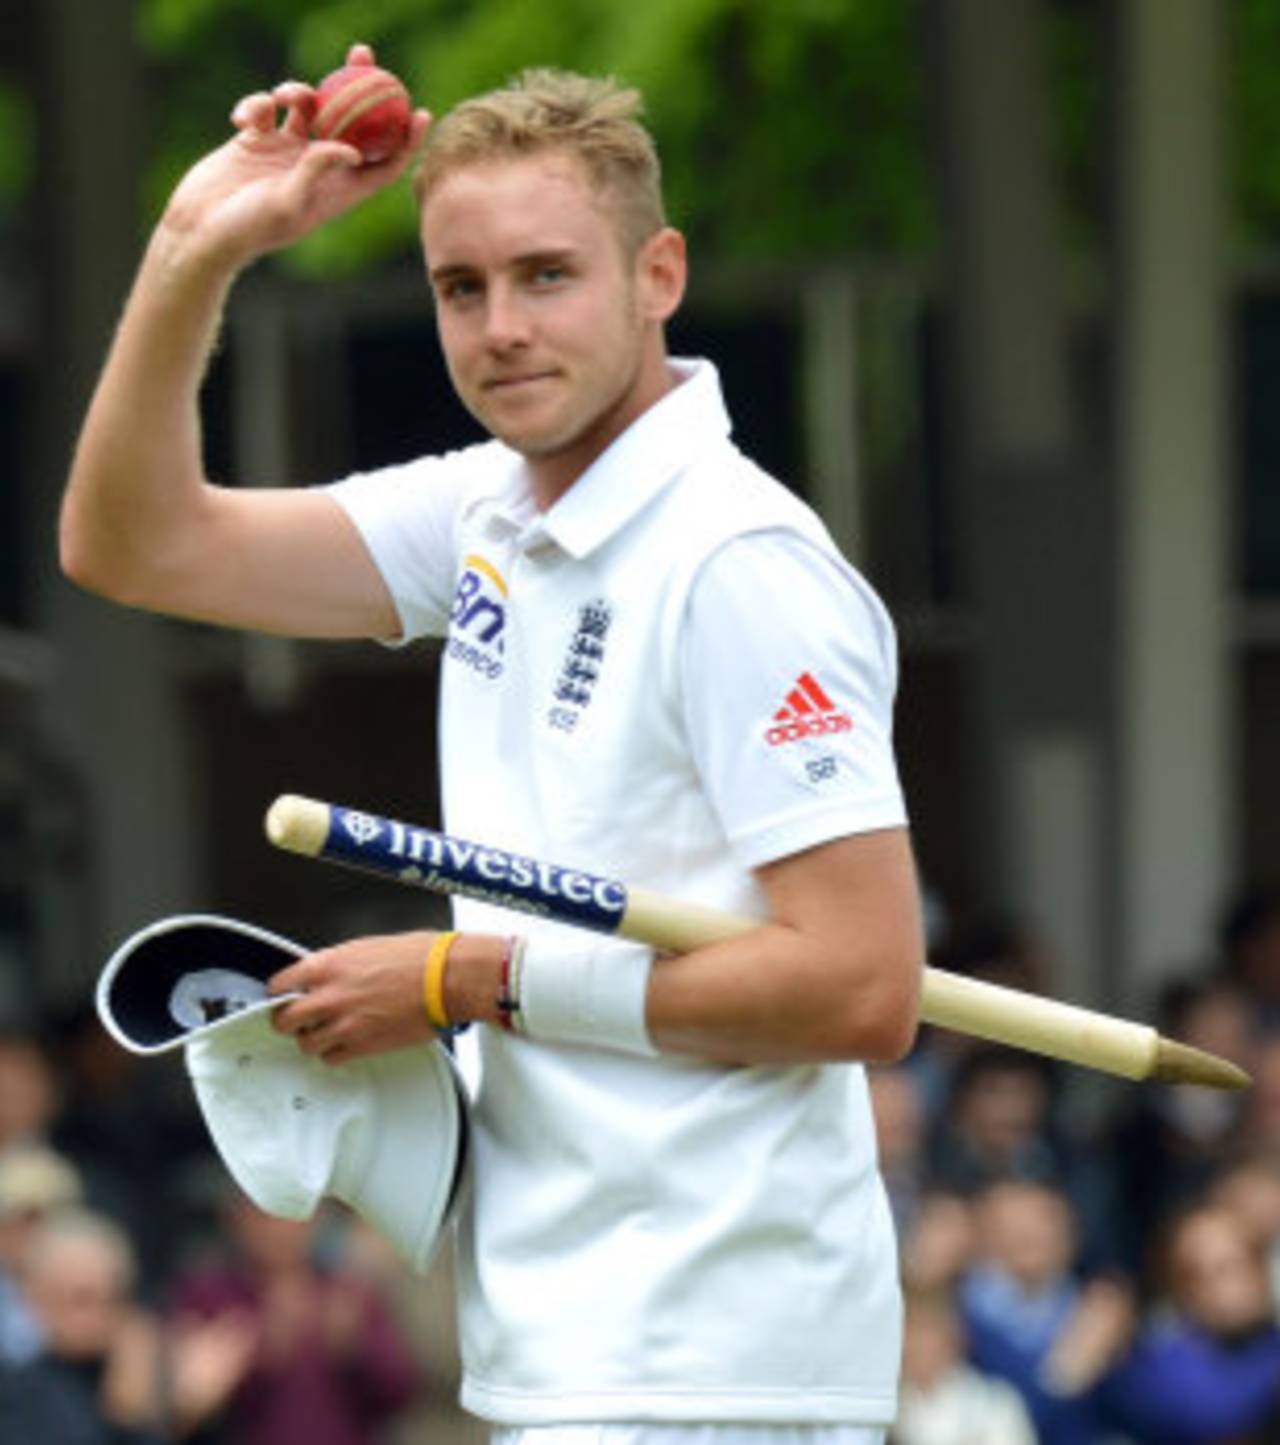
In the 20% of his Test performances when he has been at his best, Stuart Broad averages 12.48 runs per wicket; the rest of the time, though, his average is 47.79 • PA Photos
In the second innings of the Lord's Test, Stuart Broad shrugged off his poor bowling form quite spectacularly, taking seven wickets in 11 overs after his previous 82 overs had fetched him 3 for 244. Before that barren spell, there'd been a haul of 6 for 51 in Wellington, which had in turned followed a period when he took six wickets in 109 overs, conceding 429 runs, including a wicketless 36 overs in two Tests in India.
Lack of consistency has been a constant in Broad's bowling career so far, which has made it a frustrating experience for fans who've invested in him: when he's good, he can be outstanding; when he's ordinary, he can be quite poor. The home series against India in 2011 was another fine example of his extremes: he took 25 wickets at 13.84 in four Tests after having taken 10 for 551 in his previous five Tests.
Broad's haul at Lord's means he now has 191 Test wickets, 13th among England's fast bowlers. His average of 31.15 is one of the higher ones, but there are a few others in that group who are in the 30-plus category: Andrew Flintoff averages 33.34, Steve Harmison 31.94, and both Matthew Hoggard and James Anderson slightly over 30.
However, there's one stat in which Broad leads among these 13 bowlers: the ratio of averages between their top 20% performances and the rest. The table below lists all these 13 bowlers, and looks at their figures - broken up by each innings - in 20% of their best performances, and the remaining 80% (sorted by wickets taken in each innings). For example, in his best 20 bowling displays, in terms of wickets taken, Broad took 90 at an average of 12.48; in his remaining 80 innings, he took 101 wickets at an average touching 48. The ratio of those two averages is 3.83, which is the highest among the 13 leading fast bowlers for England. It's a stat that confirms what's been written over the last week about Broad's staggering inconsistency as a Test bowler.
There are a couple of other tall fast bowlers whose spread of wickets and ratio of averages resemble those of Broad. Steve Harmison's overall stats are similar to Broad's as well - an average of 31.82 and exactly as many five-fors and ten-fors as Broad - and his break-up along these parameters resemble Broad's as well. In his top 20% performances (23 innings out of 115), he has taken 101 wickets at 12.61, but in his remaining 92 performances, he averages 47.34, which means the ratio of those two averages is 3.75, remarkably close to Broad's 3.83.
The other bowler who squeezes between this is Andrew Caddick, another blow-hot, blow-cold performer. His overall career average was marginally less than 30, but he had his swings as well: on his best days, he averaged less than 12 runs per wicket, but in the remaining 80% of the time his average ballooned to almost 45. Apart from the ratios, the absolute averages of these bowlers in their remaining 80% of the innings are also the poorest among the lot, which also confirms why all these bowlers have had more than their fair share of detractors.
| Top 20% innings* | Rest of the innings | |||||||
| Innings | Wickets | Average | Innings | Wickets | Average | Ave. ratio | Career ave. | |
| Stuart Broad | 20 | 90 | 12.48 | 80 | 101 | 47.79 | 3.83 | 31.15 |
| Andrew Caddick | 21 | 104 | 11.67 | 84 | 130 | 44.50 | 3.81 | 29.91 |
| Steve Harmison | 23 | 101 | 12.61 | 92 | 125 | 47.34 | 3.75 | 31.94 |
| Ian Botham | 34 | 178 | 12.32 | 134 | 205 | 42.37 | 3.44 | 28.40 |
| Alec Bedser | 18 | 99 | 10.92 | 74 | 137 | 35.00 | 3.20 | 24.89 |
| Brian Statham | 26 | 110 | 11.20 | 103 | 142 | 35.41 | 3.16 | 24.84 |
| Bob Willis | 33 | 150 | 11.83 | 132 | 175 | 36.66 | 3.10 | 25.20 |
| Fred Trueman | 25 | 127 | 10.12 | 102 | 180 | 29.67 | 2.93 | 21.57 |
| Matthew Hoggard | 24 | 106 | 14.87 | 98 | 142 | 42.17 | 2.84 | 30.50 |
| James Anderson | 30 | 136 | 14.97 | 119 | 169 | 42.36 | 2.83 | 30.14 |
| Andrew Flintoff | 27 | 98 | 16.43 | 110 | 128 | 45.31 | 2.76 | 33.34 |
| Darren Gough | 19 | 87 | 14.32 | 76 | 142 | 37.02 | 2.58 | 28.39 |
| John Snow | 19 | 90 | 15.43 | 74 | 112 | 35.70 | 2.31 | 26.66 |
Broad, Caddick and Harmison are the only ones whose ratio of averages is more than 3.70, and in fact they are well clear of the next-highest ratio, Ian Botham's 3.44.
At the other end of the table are the most consistent bowlers of this lot. John Snow's average in his best 20% was 15.43, among the higher ones in the group, but in the other 80% of the innings his average was 35.70, among the better ones in the table. His ratio of 2.31 is the lowest, followed by Darren Gough's 2.58. Just as England had Gough's consistency to complement Caddick, similarly in the current attack James Anderson has been performing Gough's role. In the last 12 series he's played, only twice has his average exceeded 35, while eight times it's been under 30, which is pretty good indication of his consistency. Anderson's best hasn't been as potent as Broad's - he averages 14.97 to Broad's 12.48 - but his poorer days haven't been as bad as Broad's either.
Alec Bedser and Brian Statham have superb numbers too, with averages of around 11 on their best days, but the best of the lot is clearly Fred Trueman. His overall average is the best, so it isn't surprising that in each of the two parameters he emerges on top too. In his top 20% performances, he averages 10.12; in the other 80% too, his average is less than 30, the only bowler among these 13 bowlers to achieve this.
And finally, the table below compares some of the best fast bowlers in the world along the same parameters: their numbers in their best 20% of the innings they've bowled in (in terms of wickets taken), and a comparison with the remaining 80% of their innings, with a ratio of their averages in these two segments.
Three of the ten bowlers in the list below have averaged less than ten runs per wickets in their best 20% - Dale Steyn, Malcolm Marshall and Curtly Ambrose. These three also have the highest ratios, but that's because of their abnormally low averages when they're at the top of their games. Dennis Lillee's average of 13.62 is the highest in the best 20%, and that also shows that Broad has been even more lethal than Lillee when the top 20% performances of both bowlers are compared. Lillee, though, has obviously been more consistent and impressive in the remaining 80%, as have all the bowlers in the list below.
In fact, all the bowlers in the list below have impressive averages even when the remaining 80% of their performances are taken into account: the averages are all in the late 20s or very early 30s. Which is a good illustration of the fact that the best of several bowlers is about the same; what separates the truly great ones from the rest is the way they perform when they aren't necessarily at the top of their games. That's one lesson Stuart Broad would do well to assimilate.
| Top 20% innings* | Rest of the innings | |||||||
| Innings | Wickets | Average | Innings | Wickets | Average | Ave ratio | Career ave | |
| Dale Steyn | 24 | 123 | 9.67 | 98 | 209 | 30.31 | 3.13 | 22.65 |
| Malcolm Marshall | 30 | 153 | 9.35 | 121 | 223 | 28.91 | 3.09 | 20.94 |
| Curtly Ambrose | 36 | 176 | 9.97 | 143 | 229 | 29.46 | 2.95 | 20.99 |
| Glenn McGrath | 49 | 241 | 10.62 | 194 | 322 | 29.89 | 2.81 | 21.64 |
| Richard Hadlee | 30 | 171 | 10.70 | 120 | 260 | 29.93 | 2.79 | 22.29 |
| Allan Donald | 26 | 132 | 11.27 | 103 | 198 | 29.58 | 2.63 | 22.25 |
| Wasim Akram | 36 | 177 | 12.42 | 145 | 237 | 31.99 | 2.58 | 23.62 |
| Imran Khan | 28 | 155 | 12.21 | 114 | 207 | 30.75 | 2.52 | 22.81 |
| Waqar Younis | 31 | 157 | 12.55 | 123 | 216 | 31.56 | 2.51 | 23.56 |
| Dennis Lillee | 26 | 138 | 13.62 | 106 | 217 | 30.47 | 2.24 | 23.92 |
S Rajesh is stats editor of ESPNcricinfo. Follow him on Twitter