The difference between England's and Australia's top orders
Going into the Ashes, England's top four has a solid look to it. Australia's, on the other hand, has plenty to prove
S Rajesh
Jul 5, 2013, 3:01 AM
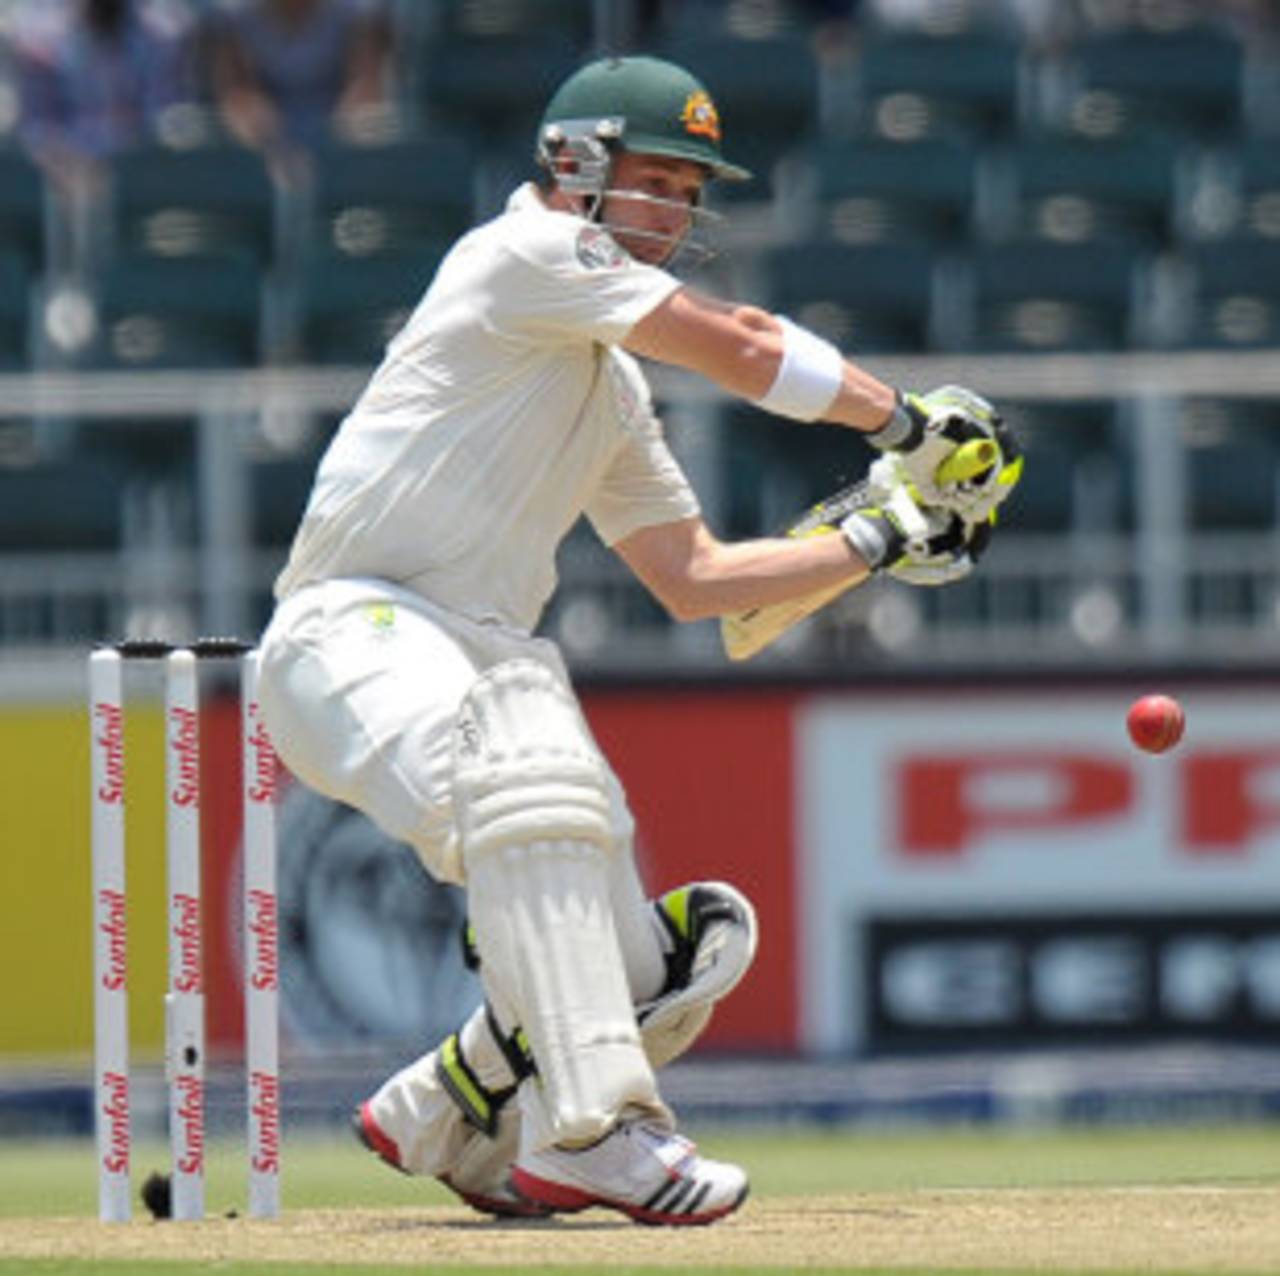
Phil Hughes is one of the batsmen in contention for a top-order slot in the Ashes, but his record so far isn't convincing • AFP
With less than a week to go for the Ashes to begin, Australia are still trying to figure out their best combination, with the batting, especially, causing plenty of concern. Since Darren Lehmann took over as coach, the opening combination has been firmed up, but there are plenty of contenders for the rest of the slots: Phil Hughes, Ed Cowan, David Warner, Usman Khawaja and Steven Smith all fighting for the two or three remaining spots (depending on whether Australia play four bowlers or five).
There used to be a time, not so long ago, when Australia's batting line-up was among the most settled, but all that has changed with the retirement of several stalwarts. England, on the other hand, have a more well-settled top order, though Joe Root's promotion to the top of the order is a fairly significant change. With Kevin Pietersen back and in form, the line-up of Alastair Cook, Jonathan Trott, Pietersen and Bell looks quite formidable on paper. The difference between the two line-ups is also quite stark when comparing the stats at each batting position over the last 40 months.
Since the beginning of March 2010, England have a 22-9 win-loss record, compared to Australia's 16-13, and they've scored 40 runs per wicket compared to Australia's 34.15. As the table below shows, the difference in averages for the openers during this period is almost ten runs per wicket, which is fairly significant, but even that isn't much compared to the difference in stats for the No. 3 and No. 4 batsmen.
These two slots have a history of excellence associated with them, with Don Bradman, Ian and Greg Chappell, and Ricky Ponting scoring tons of runs from there, but currently Australia's cupboard looks rather bare. In these last 40 months, their No. 3 and No. 4 batsmen have both averaged less than 30, while England's have averaged more than 50. That's a huge gap, and potentially a huge worry for Australia. Adding up the difference in averages for the first four batsmen gives the grand sum of 67.41 runs (multiplying the openers' difference by two), which is a substantial difference that the rest of their batsmen need to make up.
Australia's big strength has been the No. 5 spot, where they've averaged more than 60, thanks largely to Michael Clarke, who has averaged almost 82 at that slot during this period, with some help from the now-retired Michael Hussey, who averaged nearly 50.
Australia's average at No. 6 is also a bit higher than England's, but that's due to Hussey, who scored 1184 at 51.47. He won't be around to help Australia during the Ashes. At No. 7, England have the clear advantage thanks to Matt Prior.
| Position | Team | Innings | Runs | Average | 100s/ 50s |
| Openers | England | 138 | 5945 | 45.73 | 20/ 18 |
| Australia | 130 | 4505 | 36.04 | 7/ 28 | |
| No.3 | England | 68 | 3329 | 53.69 | 9/ 15 |
| Australia | 64 | 1712 | 27.61 | 1/ 12 | |
| No.4 | England | 64 | 3102 | 51.70 | 7/ 17 |
| Australia | 62 | 1815 | 29.75 | 2/ 12 | |
| No.5 | England | 62 | 2011 | 35.28 | 7/ 8 |
| Australia | 62 | 3753 | 64.70 | 13/ 10 | |
| No.6 | England | 61 | 1789 | 33.75 | 2/ 12 |
| Australia | 62 | 2139 | 38.19 | 8/ 6 | |
| No.7 | England | 59 | 2066 | 43.95 | 4/ 14 |
| Australia | 61 | 1708 | 34.16 | 2/ 12 | |
| Nos.8-11 | England | 191 | 2629 | 18.25 | 3/ 7 |
| Australia | 212 | 2837 | 18.07 | 0/ 11 |
Coming back to the top four slots, Australia's big problem has been their inability to convert their starts into bigger scores. Their top four batsmen have gone past fifty 62 times in Tests during this period, but have converted only ten of those into centuries. England's top four, on the other hand, have scored 36 centuries out of the 86 times they've gone past 50. England's conversion rate: 42%; Australia's: 16%. For them to have a chance in the Ashes, Australia's batsmen will have to do much better than that.
The problem for Australia begins with the opening slot, where their batsmen have managed only seven centuries out of 35 scores of 50-plus. Shane Watson and Ed Cowan have been the chief culprits, with a combined record of two out of 16. England's star at the top of the order has been Cook, who has piled up hundreds at an amazing rate: 15 out of 22 scores of 50-plus have been centuries. Among the other seven innings are three scores in the 90s - 96, 94 and 94. Even Nick Compton, who otherwise has pretty ordinary numbers, has converted two of his three 50-plus scores into hundreds.
| Batsman | Innings | Runs | Average | 100s/ 50s |
| Alastair Cook | 69 | 3728 | 58.25 | 15/ 7 |
| Andrew Strauss | 47 | 1579 | 34.32 | 3/ 9 |
| David Warner | 33 | 1240 | 40.00 | 3/ 7 |
| Shane Watson | 30 | 1046 | 36.06 | 1/ 8 |
| Ed Cowan | 29 | 963 | 33.20 | 1/ 6 |
| Simon Katich | 16 | 685 | 45.66 | 1/ 5 |
| Phil Hughes | 21 | 563 | 28.15 | 1/ 2 |
| Nick Compton | 17 | 479 | 31.93 | 2/ 1 |
Australia have decided on their opening combination for the first Ashes Test, but they haven't quite nailed their Nos. 3 and 4 yet, and those are two positions that have caused them plenty of grief in the last few years. As the table below shows, the three batsmen who have averaged more than 50 at these positions are all from England, with Trott and Pietersen being the dominant ones.
Australia's leading scorers at these positions all have poor averages. Ponting has scored 1515 runs, but he was clearly not at his best during this period: it took him 46 innings to score those runs, which means his average was only 34.43. Like most of the other Australian batsmen, his conversion rate was poor too, with only two hundreds to go with 11 fifties.
The other Australian batsmen, though, have fared even worse than him. Clarke has been outstanding at No. 5, but 24 innings at higher slots - all except one of those at No. 4 - have fetched only 544 runs at a poor average of 22.66. He has never gone past 80 in those 24 innings. Watson's returns aren't impressive either - 423 runs in 15 innings at 28.20. Hughes, Marsh and Khawaja are the others who have tried their hand at these positions but without too much success.
Come Wednesday at Trent Bridge, Australia will want much more from their top four. How they go against England's top-class pace attack could well determine which way the series goes. For a start, Australia will be hoping that Chris Rogers' presence at the top of the line-up makes a difference.
| Batsman | Innings | Runs | Average | 100s/ 50s |
| Jonathan Trott | 62 | 3015 | 53.83 | 8/ 14 |
| Kevin Pietersen | 51 | 2595 | 55.21 | 6/ 14 |
| Ricky Ponting | 46 | 1515 | 34.43 | 2/ 11 |
| Ian Bell | 11 | 652 | 59.27 | 2/ 2 |
| Michael Clarke | 24 | 544 | 22.66 | 0/ 4 |
| Shane Watson | 15 | 423 | 28.20 | 0/ 3 |
| Phil Hughes | 13 | 380 | 29.23 | 0/ 3 |
| Shaun Marsh | 10 | 301 | 30.10 | 1/ 1 |
| Usman Khawaja | 8 | 203 | 29.00 | 0/ 1 |
S Rajesh is stats editor of ESPNcricinfo. Follow him on Twitter