The ups and downs of Harbhajan Singh
India's lead spinner's major problem in the last four years has been his display in home Tests. Can the Kolkata performance spark a revival?
S Rajesh
Feb 19, 2010, 12:52 AM
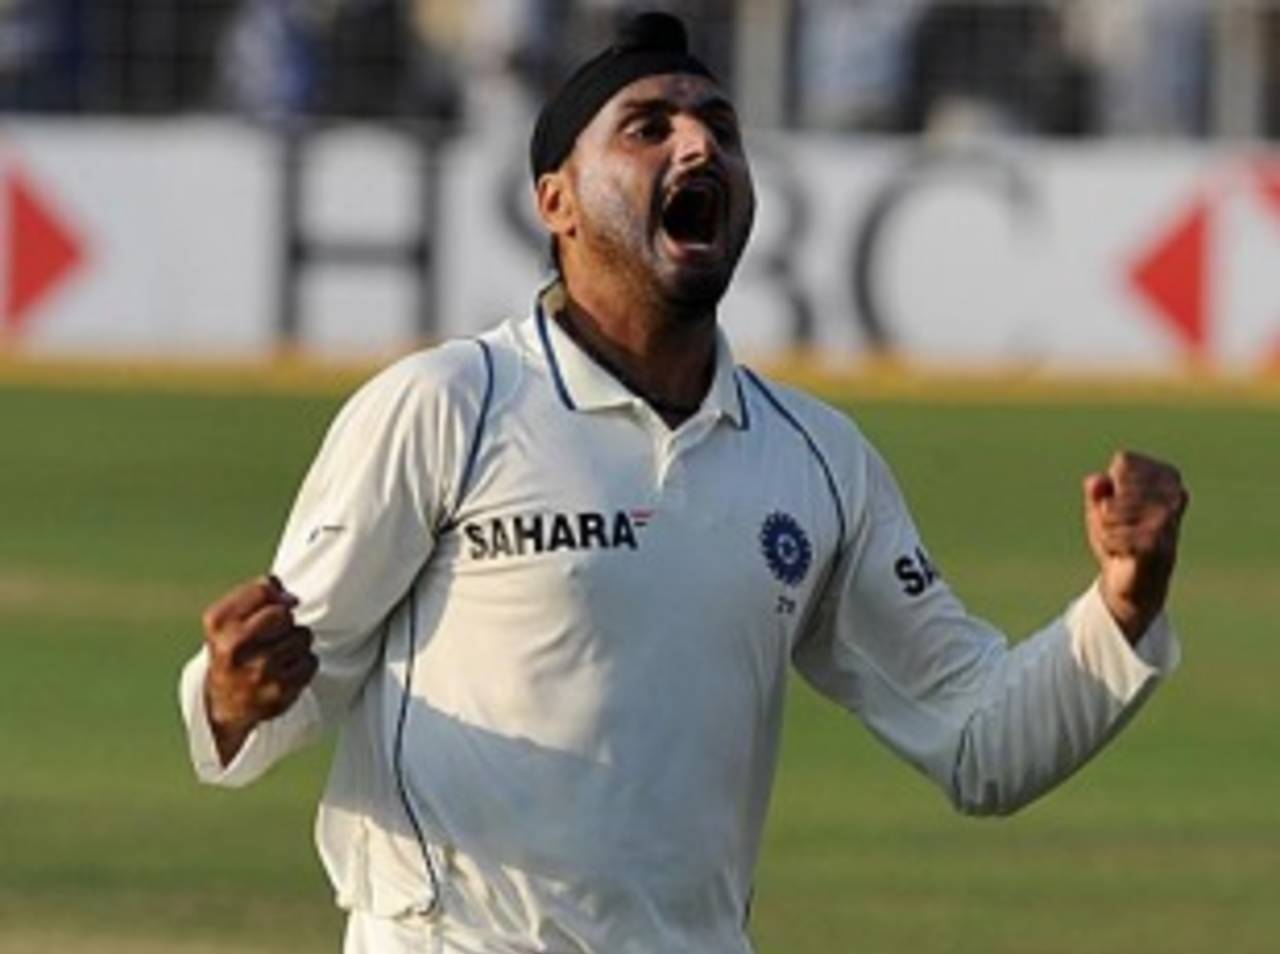
Harbhajan Singh's Test numbers have dropped in the last four years. Can his match-winning display in Kolkata spark a revival? • AFP
The last four years have been a difficult time for Harbhajan Singh. The wickets have dried up, match-winning performances have been few and far between, and the clamour for him to justify his place in the team has got louder. From being among the pre-eminent spinners in world cricket at a time when the field was much stronger, Harbhajan is struggling to hold his own even in a reduced field.
Which is why his superb display in Kolkata should be a huge boost to his confidence. Eden Gardens has lifted Harbhajan's stock more than once, and it was only fitting that he went past Anil Kumble to become the leading wicket-taker at the venue. The flight, the drift, the bounce, the turn and the accuracy were all back on display over the last five days, but Harbhajan will know he needs to consistently maintain these standards.
A break-up of his numbers before and after 2006 tells a story. In the period from 2001 to 2005 he was excellent, averaging a wicket every 59 deliveries, with 17 five-fors in 42 matches. Since then, his striking powers have waned considerably: his 5 for 59 against South Africa was only his seventh five-wicket haul in 33 Tests during this period, while the strike rate has risen to 74 balls per wicket, an increase of 15 deliveries from his best days.
| Period | Tests | Wickets | Average | Strike rate | 5WI/ 10WM |
| Before 2001 | 8 | 21 | 38.57 | 81.6 | 0/ 0 |
| 2001 to 2005 | 42 | 198 | 26.74 | 58.7 | 17/ 4 |
| 2006 onwards | 33 | 136 | 35.88 | 73.8 | 7/ 1 |
| Overall | 83 | 355 | 30.94 | 65.9 | 24/ 5 |
The impatience with Harbhajan's performances has been especially marked when he has performed at home, in conditions that are generally more favourable for spin bowling. During his five best years, Harbhajan averaged more than six wickets per Test in India, and took an incredible 15 five-fors in 23 Tests. In the last four years, though, he has only managed three such hauls in 19 matches, while the average has dipped by more than 50%. It's a similar story in matches in the subcontinent, where his average has ballooned from 24.47 to 37.46.
During this period, his overseas average has been remarkably similar - an average of 36.92 and a strike rate of 74.5 balls per wicket between 2001 and 2005, and an average of 38.18 at a strike rate of 73.6 from 2006 onwards. In fact, he has taken four five-fors in 14 away Tests during this period, compared with two in 19 matches during the earlier five years. Clearly, Harbhajan overseas remains an ordinary performer, but it's his decline in home games that has been worrying. And that's also why the Kolkata performance is such a relief.
| Tests | Wickets | Average | Strike rate | 5WI/ 10WM | |
| At home - 2001 to 2005 | 23 | 141 | 22.62 | 52.4 | 15/ 4 |
| At home - 2006 onwards | 19 | 83 | 34.40 | 73.9 | 3/ 0 |
| In Asia - 2001 to 2005 | 28 | 149 | 24.47 | 55.4 | 15/ 4 |
| In Asia - 2006 onwards | 25 | 101 | 37.46 | 77.2 | 4/ 1 |
When in his pomp, Harbhajan was generally named among the leading spinners in world cricket, even when the field included such luminaries as Shane Warne and Anil Kumble. Between 2001 and 2005, his average of 26.74 put him in third place among spinners with 50 wickets, with only Muttiah Muralitharan and Warne before him. He had a strike rate that was marginally better than Kumble's during that period. In fact, all his five Man-of-the-Match awards came during that period, the last one against Sri Lanka in Ahmedabad in December 2005.
| Bowler | Tests | Wickets | Average | Strike rate | 5WI/ 10WM |
| Muttiah Muralitharan | 41 | 282 | 19.59 | 51.5 | 24/ 9 |
| Shane Warne | 50 | 291 | 23.77 | 48.7 | 18/ 6 |
| Harbhajan Singh | 42 | 198 | 26.74 | 58.7 | 17/ 4 |
| Sanath Jayasuriya | 46 | 55 | 27.23 | 73.5 | 2/ 0 |
| Anil Kumble | 39 | 209 | 27.97 | 59.2 | 15/ 5 |
| Stuart MacGill | 22 | 110 | 29.69 | 55.5 | 8/ 1 |
Over the last four years, though, several spinners have stolen a march over him. With the same cut-off, eight spinners have a better average than his 35.88. Graeme Swann and even Nathan Hauritz (whose 48 wickets have come at an average of 30.16) have, over the last couple of years, challenged Harbhajan's status as the premier conventional offspinner. Meanwhile four left-arm spinners are also ahead of Harbhajan in terms of averages, including Monty Panesar and Paul Harris.
| Bowler | Tests | Wickets | Average | Strike rate | 5WI/ 10WM |
| Muttiah Muralitharan | 33 | 208 | 23.37 | 50.4 | 18/ 8 |
| Graeme Swann | 16 | 69 | 30.69 | 60.9 | 4/ 0 |
| Shakib Al Hasan | 17 | 58 | 30.72 | 66.3 | 6/ 0 |
| Daniel Vettori | 33 | 110 | 30.72 | 73.3 | 6/ 1 |
| Shane Warne | 11 | 51 | 30.82 | 59.2 | 3/ 0 |
| Monty Panesar | 39 | 126 | 34.37 | 71.7 | 8/ 1 |
| Paul Harris | 29 | 87 | 35.12 | 75.9 | 3/ 0 |
| Anil Kumble | 32 | 134 | 35.67 | 69.8 | 4/ 0 |
| Harbhajan Singh | 33 | 136 | 35.88 | 73.8 | 7/ 1 |
| Danish Kaneria | 27 | 111 | 39.05 | 75.8 | 4/ 0 |
There used to be a time when Harbhajan's variations, especially the doosra, used to deceive several right-handers and make him especially effective against them. Perhaps due to overuse, however, batsmen seem to be picking that variation more successfully of late. In the last four years, Harbhajan's effectiveness against right-handers has gone down significantly - between 2001 and 2005 he averaged less than 26 against them; in the last four years it's gone up to almost 38. His average against left-handers has improved marginally during this period.
The two-Test series against South Africa brought out the contrast even more vividly, though admittedly the visitors were carrying two left-handers in their batting line-up who were woefully out of form and were walking wickets for Harbhajan. Of the 10 wickets he took in the series, six were of left-handers, at an incredible average of 5.16. Against the right-handers, he conceded 64.50 runs per wicket.
| Wickets | Average | Strike rate | Econ rate | |
| Right-handers - Jun 2001 to 2005 | 119 | 25.73 | 56.21 | 2.74 |
| Right-handers - 2006 onwards | 88 | 38.02 | 73.35 | 3.11 |
| Left-handers - Jun 2001 to 2005 | 47 | 35.81 | 82.66 | 2.59 |
| Left-handers - 2006 onwards | 48 | 31.71 | 75.02 | 2.53 |
A look at Harbhajan's stats against some of the top right-handers over the last four years presents interesting numbers: against arguably the two best ones of the lot, Harbhajan has done very well: he has dismissed both Ricky Ponting and Jacques Kallis five times each at excellent averages, but he has struggled against some of the others. Mahela Jayawardene and Younis Khan average more than 200 against him, while Misbah-ul-Haq hasn't been dismissed by him in 248 deliveries.
| Batsman | Runs | Balls | Dismissals | Average | Runs per over |
| Hashim Amla | 234 | 483 | 2 | 117.00 | 2.90 |
| Younis Khan | 222 | 354 | 1 | 222.00 | 3.76 |
| Mahela Jayawardene | 207 | 342 | 1 | 207.00 | 3.63 |
| Mishbah-ul-Haq | 142 | 248 | 0 | - | 3.43 |
| Jacques Kallis | 127 | 250 | 5 | 25.40 | 3.04 |
| AB de Villiers | 126 | 241 | 1 | 126.00 | 3.13 |
| Ricky Ponting | 112 | 193 | 5 | 22.40 | 3.48 |
| Michael Clarke | 100 | 220 | 1 | 100.00 | 2.72 |
Some of these numbers indicate a bumpy ride over the last four years, but as he showed in Kolkata, the skills are still intact. And for those who think the absence of Anil Kumble has hurt Harbhajan, here's a stat to dispel that notion: since 2006 Harbhajan has done much better when Kumble hasn't been in the team than when he has. Will Kolkata be the catalyst that revives Harbhajan's Test career?
| Tests | Wickets | Average | Strike rate | 5WI/ 10WM | |
| With Kumble | 19 | 68 | 43.57 | 83.5 | 3.12 |
| Without Kumble | 14 | 68 | 28.19 | 64.1 | 2/ 0 |
S Rajesh is stats editor of Cricinfo