Amazing to abysmal over three decades
Series between Australia and West Indies used to be keenly anticipated not so long ago, but over the last 10 years the stats have been hopelessly one-sided
S Rajesh
20-Nov-2009
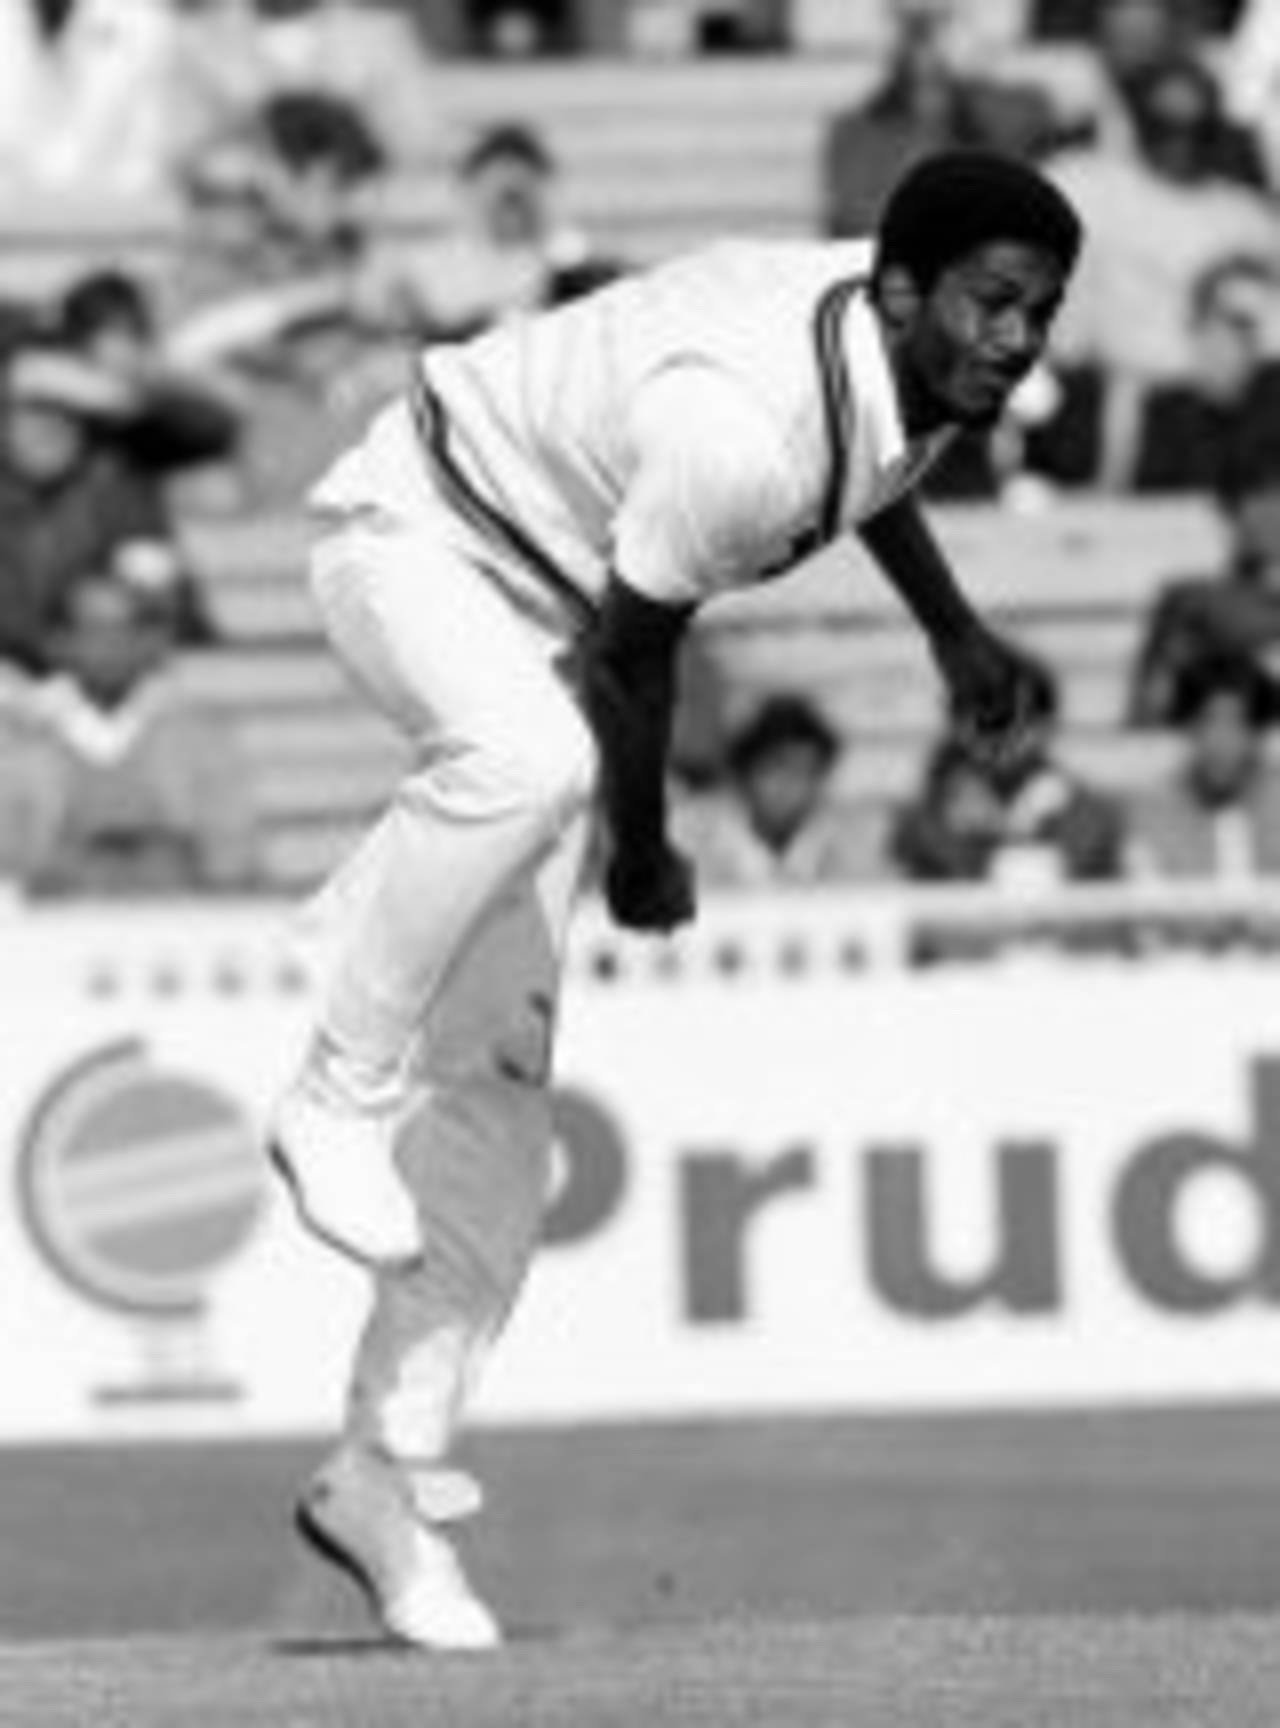
Seven Tests in Australia during the 80s, 45 wickets, average 14.75. They don't make 'em like Holding anymore • Adrian Murrell/AllSport UK Ltd
There used to be a time when an Australia-West Indies series was the most keenly anticipated encounter in international cricket. Both teams had outstanding fast bowlers, high-class batsmen, and a fierce sense of pride which ensured neither side gave an inch to the other. Alas, West Indies' fall over the last decade or so has been so great that matches between the two teams - especially those played in Australia - are a foregone conclusion even before the first ball is delivered: when West Indies start the three-Test series on November 26, they'll be attempting to end a losing streak of eight successive Tests in Australia.
It wasn't always so dismal, though. In the 1980s, West Indies clearly had the wood on the Australians, winning two out of the three series they played there, and drawing the other. (They also played the last Test of the 1979-80 series during this decade, a match they won by 408 runs.) The series in 1981-82 was drawn, but in the next two series - both over five Tests - they won the first three convincingly, before losing one of the last two dead matches.
In the 1990s things were a lot tighter, with West Indies' series win in 1992-93 being decided by a one-run margin, when they sneaked through in Adelaide. Australia won 3-2 in 1996-97, ensuring that honours were even for the decade. In the 2000s, though, there's been nothing close about the games, with West Indies being swamped in all eight Tests.
The batting and bowling averages for West Indies in each decade reveal the story: in the 1980s, not only did they average more than Australia, they also scored at an impressive 3.22 runs per over. Over the last two decades, the average has shrunk, and so has the scoring rate. In the 2000s, a period when run rates all over the world have generally been on the rise, West Indies have slipped to 2.74 in Australia.
| Period | Tests | Won | Lost | Draw | Bat ave/Run rate | Bowl ave/ Run rate |
| 1980s | 14 | 8 | 3 | 3 | 34.38/ 3.22 | 27.40/ 2.83 |
| 1990s | 10 | 4 | 4 | 2 | 27.72/ 2.98 | 30.41/ 2.84 |
| 2000s | 8 | 0 | 8 | 0 | 21.47/ 2.74 | 44.13/ 3.44 |
The table below has names that should inspire Chris Gayle and Co over the next month. In the 1980s, there were four West Indian batsmen who averaged more than 40 in Australia. Leading the way, though, was a player who is hardly ever mentioned when discussing the West Indian greats of the 1980s. Larry Gomes played eight Tests in Australia during this period, scored four centuries, and averaged 70.33, which was well above his career average of 39.63.
Through the two series in 1981-82 and 1984-85, Gomes was the standout batsman, and he received excellent support from the rest. Clive Lloyd had seven 50-plus scores in nine Tests, Viv Richards was the only West Indian to score more than 1000 runs in Australia during this period, and though Jeff Dujon averaged less than 40, he was involved in some invaluable partnerships that turned games around. None was more memorable than the 199 runs he added (in two instalments) with Gomes in the first Test in Perth in 1984, which lifted West Indies from the depths of 104 for 5 to a total of 416, and ultimately a win by an innings and 112 runs. (Click here for more partnership details for West Indies in Australia during this decade.)
| Batsman | Tests | Runs | Average | Strike rate | 100s/ 50s |
| Larry Gomes | 8 | 844 | 70.33 | 44.84 | 4/ 3 |
| Clive Lloyd | 9 | 792 | 56.57 | 58.71 | 2/ 5 |
| Viv Richards | 14 | 1098 | 45.75 | 68.84 | 2/8 |
| Richie Richardson | 10 | 764 | 42.44 | 46.95 | 3/ 3 |
| Jeff Dujon | 13 | 763 | 38.15 | 50.19 | 1/ 2 |
| Desmond Haynes | 14 | 964 | 37.07 | 43.03 | 2/ 6 |
| Gordon Greenidge | 13 | 827 | 35.95 | 45.76 | 1/ 6 |
In the 1990s, the numbers dropped a bit, which, coupled with the smaller number of Tests West Indies played in Australia, means the qualification drops from 750 to 250 runs. Keith Arthurton leads with an average of 52.14, but that's thanks largely to one innings of 157 not out. In eight innings, he failed to get off the mark three times. Brian Lara scored two hundreds but his average was a touch under 45, while Carl Hooper was a huge disappointment, averaging less than 33 in nine Tests.
| Batsman | Tests | Runs | Average | Strike rate | 100s/ 50s |
| Keith Arthurton | 5 | 365 | 52.14 | 43.14 | 1/ 2 |
| Richie Richardson | 5 | 380 | 47.50 | 49.15 | 1/ 3 |
| Brian Lara | 10 | 762 | 44.82 | 58.43 | 2/ 4 |
| Shivnarine Chanderpaul | 5 | 344 | 38.22 | 43.37 | 0/ 3 |
| Carl Hooper | 9 | 492 | 32.80 | 46.15 | 1/ 2 |
| Sherwin Campbell | 5 | 291 | 32.33 | 36.92 | 1/ 1 |
| Phil Simmons | 6 | 283 | 31.44 | 54.63 | 1/ 1 |
| Jimmy Adams | 8 | 288 | 28.80 | 39.66 | 0/ 2 |
In the current decade, though, the numbers are a complete shambles. The qualification mark drops further, to 150 runs, and even then, the only batsman who averages more than 42 is Dwayne Bravo, who has played only four innings in Australia. Lara's aggregate is easily the highest, but his average drops to 41.62, with only two 50-plus scores (both converted to hundreds) in 16 innings.
The rest of the batsmen have fared even worse, with four of them - including Shivnarine Chanderpaul and Ramnaresh Sarwan - averaging less than 25.
| Batsman | Tests | Runs | Average | Strike rate | 100s/ 50s |
| Dwayne Bravo | 2 | 214 | 53.50 | 52.97 | 1/ 1 |
| Brian Lara | 8 | 666 | 41.62 | 61.60 | 2/ 0 |
| Denesh Ramdin | 3 | 171 | 34.20 | 44.64 | 0/ 1 |
| Ridley Jacobs | 5 | 288 | 32.00 | 50.52 | 0/ 2 |
| Marlon Samuels | 5 | 228 | 28.50 | 40.71 | 0/ 1 |
| Wavell Hinds | 5 | 272 | 27.20 | 42.90 | 0/ 2 |
| Shivnarine Chanderpaul | 4 | 167 | 23.85 | 34.50 | 0/ 1 |
| Jimmy Adams | 5 | 151 | 18.87 | 31.45 | 0/ 0 |
| Sherwin Campbell | 5 | 187 | 18.70 | 30.35 | 0/ 2 |
| Ramnaresh Sarwan | 6 | 218 | 18.16 | 45.51 | 0/ 2 |
Turning to the bowlers, the gulf is equally huge between the current crop and those from the past. In the 1980s, Michael Holding was so brilliant that he stood out even among a crop that included Malcolm Marshall, Joel Garner and Curtly Ambrose. In seven Tests, Holding bagged 45 wickets, including five five-wicket hauls, averaged less than 15, and struck every 34 deliveries. One of those performances was particularly memorable - in the Test in which Gomes and Dujon shared that huge partnership, Holding destroyed Australia with figures of 6 for 21 in the first innings, a display that won him the Man-of-the-Match award.
| Bowler | Tests | Wickets | Average | Strike rate | 5WI/ 10WM |
| Michael Holding | 7 | 45 | 14.75 | 34.2 | 5/ 1 |
| Curtly Ambrose | 5 | 26 | 21.46 | 47.1 | 1/ 0 |
| Malcolm Marshall | 10 | 45 | 23.15 | 54.3 | 5/ 1 |
| Joel Garner | 9 | 34 | 27.14 | 58.0 | 1/ 0 |
| Courtney Walsh | 10 | 30 | 31.06 | 64.6 | 0/ 0 |
In the 1990s, only three bowlers made it to the qualification mark of 25 wickets, but all three were high-quality performers, who ensured they didn't need too much support from the others to test the Australian batsmen. Ambrose was outstanding, with 52 wickets in nine Tests, including that famous haul of 7 for 25 in Perth in 1993. The underrated Ian Bishop was superb too, with a strike rate of 52 balls per wicket.
| Bowler | Tests | Wickets | Average | Strike rate | 5WI/ 10WM |
| Curtly Ambrose | 9 | 52 | 18.96 | 48.6 | 5/ 1 |
| Ian Bishop | 10 | 43 | 23.02 | 51.9 | 1/ 0 |
| Courtney Walsh | 10 | 31 | 34.16 | 71.1 | 2/ 0 |
In sharp contrast are the numbers for the current crop of bowlers. The qualification drops to eight wickets, and even then only a couple come away with respectable figures. Even for Courtney Walsh, the combination of Australian pitches and batsmen was a challenge too far - he managed only 11 wickets in five Tests.
| Bowler | Tests | Wickets | Average | Strike rate | 5WI/ 10WM |
| Dwayne Bravo | 2 | 8 | 25.12 | 42.7 | 1/ 0 |
| Merv Dillon | 4 | 16 | 29.93 | 48.2 | 0/ 0 |
| Corey Collymore | 3 | 8 | 36.50 | 81.0 | 0/ 0 |
| Courtney Walsh | 5 | 11 | 43.72 | 108.9 | 0/ 0 |
| Fidel Edwards | 3 | 8 | 52.37 | 69.8 | 0/ 0 |
| Nixon McLean | 5 | 9 | 52.88 | 91.3 | 0/ 0 |
Among the specialist bowlers in the West Indies' current squad, none has played a Test in Australia before, which is probably a good thing considering how their immediate predecessors have done. If they, and the batsmen, return with numbers resembling the 1990s stats, the Caribbean will have plenty to cheer about.
S Rajesh is stats editor of Cricinfo