Durban jinx for Tendulkar and Amla
Both Sachin Tendulkar and Hashim Amla have been hugely disappointing in Durban Tests so far. Can they rectify the anomaly this time?
S Rajesh
Dec 24, 2010, 1:55 PM
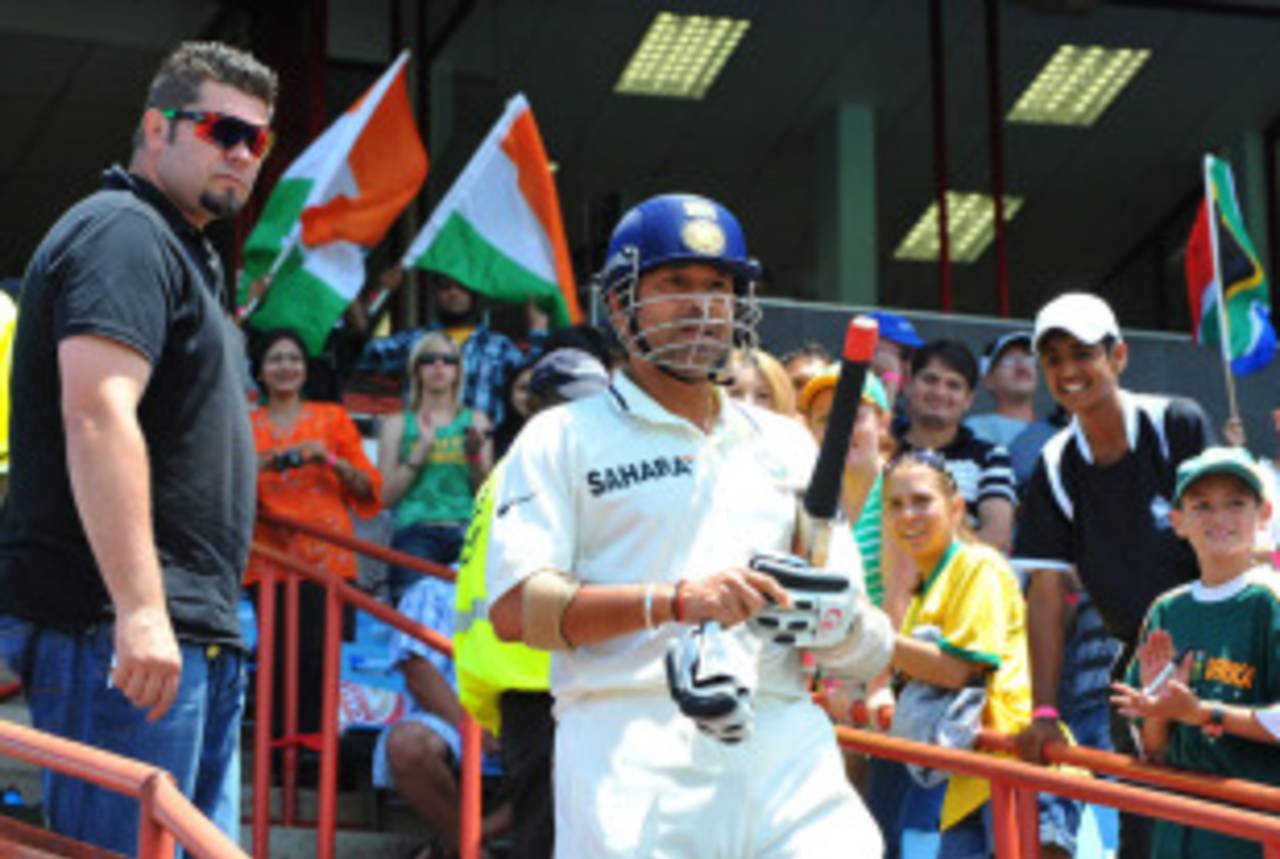
Sachin Tendulkar averages 52.29 at all the other venues in South Africa, but only 18.60 in Durban • Getty Images
South Africa's complete domination in Centurion, and the pace, seam and bounce that is likely to be on offer in Durban make the home team the firm favourites for the Boxing Day Test against an opponent that has struggled to come to grips with the Kingsmead conditions in the past. India have lost their two most recent Tests there, in 1996 and in 2006, by huge margins - by 328 runs in 1996, and by 174 runs ten years later.
India's only consolation is the fact that the home team themselves haven't been very comfortable playing here recently - they only have a 5-3 win-loss ratio at Kingsmead over the last ten years, and have lost their last two Tests. In both these matches, South Africa were bundled out for less than 150 in one of their innings: Australia bowled them out for 138 in their first innings in March 2009, while England dismissed them for 133 in the second innings in last year's Boxing Day Test. South Africa's win-loss ratio of 1.66 at this ground is only third among their home venues, and much poorer than their ratio of 9 in Centurion and 4.50 in Cape Town.
| Team | Tests | Won | Lost | Drawn |
| South Africa - since 2000 | 10 | 5 | 3 | 2 |
| India - since 1990 | 3 | 0 | 2 | 1 |
The batting and bowling stats for India at this ground indicate how difficult it's been for their batsmen to come to grips with the conditions here. In three Tests, India's totals read thus: 277 in 1992, 100 and 66 in 1996, 240 and 179 in 2006. The Indian batsmen have an overall average of 15.60, with Praveen Amre being the only one to get a hundred here - he scored a gutsy 103 in the drawn game in 1992. Their bowlers have done pretty well in Durban, averaging 28.72 runs per wicket, but the batsmen have been so poor that they haven't given the bowlers any chance at getting them back in the match.
South Africa's batsmen have done much better, averaging more than 34 runs per wicket, and scoring 12 hundreds in ten Tests.
| Team | Runs | Average | 100s | Wickets | Bowl ave |
| South Africa - since 2000 | 5108 | 34.28 | 12 | 167 | 31.39 |
| India - since 1990 | 780 | 15.60 | 1 | 51 | 28.72 |
The table below won't make pleasant reading for Indian fans: most of their batsmen have performed very poorly in Durban. Sachin Tendulkar and Rahul Dravid have been particularly disappointing: in five innings, Tendulkar has scored more than 15 only once. One of those five dismissals was a run-out, in 1992, which made him the first cricketer to be given out by the third umpire (Karl Liebenberg of South Africa). In fact, Tendulkar's performances in Durban is largely the reason why his overall stats in South Africa are below par - remove his Durban numbers, and his average in South Africa goes up to 52.29.
Dravid has been similarly poor, with scores of 7, 27 not out, 11 and 5 in his four innings in Durban, though that unbeaten 27 in an Indian total of 66 offered an early glimpse of the class and grit that he possessed.
| Batsman | Tests | Runs | Average | 100s/ 50s |
| VVS Laxman | 1 | 65 | 65.00 | 0/ 1 |
| MS Dhoni | 1 | 81 | 40.50 | 0/ 0 |
| Sachin Tendulkar | 3 | 93 | 18.60 | 0/ 1 |
| Rahul Dravid | 2 | 50 | 16.67 | 0/ 0 |
| Virender Sehwag | 1 | 8 | 4.00 | 0/ 0 |
For South African batsmen, the numbers are mixed. Jacques Kallis is the highest run-getter at the ground, and one of only two batsmen to score more than 1000 Test runs here. In 22 innings, Kallis has scored 1124 runs at an average of more than 56, with nine fifty-plus scores. He has scored at least a half-century in each of his last eight Tests at Kingsmead.
AB de Villiers has been pretty impressive too, with four fifties and a century in 11 innings, but for a couple of other batsmen the stats aren't as imposing. Graeme Smith has only managed one century in 15 innings, and an average of less than 35, but even that is pretty good compared to Hashim Amla's numbers. Amla has been batting like a dream over the last year, but Durban Tests have usually been nightmares for him: in nine innings, only twice has he scored more than 6. His list of scores in Durban look like this - 1, 0, 1, 0, 69, 0, 43, 2, 6. With 1200 Test runs already under his belt in 2010, and this game being his 50th Test match, this is perhaps the ideal opportunity for Amla to end his Durban jinx.
| Batsman | Tests | Runs | Average | 100s/ 50s |
| Jacques Kallis | 13 | 1124 | 56.20 | 4/ 5 |
| AB de Villiers | 6 | 460 | 51.11 | 1/ 4 |
| Ashwell Prince | 5 | 350 | 43.75 | 2/ 0 |
| Graeme Smith | 9 | 449 | 34.53 | 1/ 2 |
| Mark Boucher | 12 | 489 | 28.76 | 1/ 4 |
| Hashim Amla | 5 | 122 | 13.55 | 0/ 1 |
Among the South African bowlers in the current squad, none have a particularly impressive record. Dale Steyn's only five-for at this ground came against a relatively weak West Indies, but his overall stats here are well below his career average of 23.65.
| Bowler | Tests | Wickets | Average | Strike rate | 5WI/ 10WM |
| Dale Steyn | 4 | 16 | 30.62 | 53.8 | 1/ 0 |
| Jacques Kallis | 9 | 14 | 39.07 | 82.3 | 0/ 0 |
| Morne Morkel | 3 | 8 | 41.25 | 69.7 | 0/ 0 |
| Paul Harris | 2 | 3 | 93.33 | 180.0 | 0/ 0 |
And while plenty has been written and said about how much the conditions will assist fast bowlers, the fact is that spinners haven't done badly here either. Shane Warne and Muttiah Muralitharan had plenty of success at this venue - Warne took 14 wickets in two Tests and Murali 11 in one - while more recently, Graeme Swann had match figures of 9 for 164 in last year's Boxing Day Test. Overall, spinners have taken far fewer wickets than fast bowlers in Durban Tests since 2000, but their wickets have come at a lesser average than that of the fast bowlers.
| Wickets | Average | Strike rate | 5WI/ 10WM | |
| Pace | 235 | 34.26 | 63.5 | 6/ 0 |
| Spin | 76 | 31.22 | 62.1 | 4/ 1 |
The innings-wise average runs per wicket here over the last ten Tests shows batting first is generally slightly tougher than batting in the other three innings. However, there are no clear-cut trends in terms of toss decision, or in terms of batting or fielding first giving teams a distinct advantage. The captain winning the toss has batted and fielded five times each in the last ten Tests, and of the eight times a Test has ended decisively during this period, four have been won by the team batting first, and as many by the team fielding first.
| 1st innings | 2nd innings | 3rd innings | 4th innings |
| 30.37 | 36.36 | 35.35 | 34.79 |
S Rajesh is stats editor of Cricinfo