Pace like fire
The first instalment of this new series takes an in-depth look at West Indies' amazing pace attack of the 1970s, '80s and early 1990s
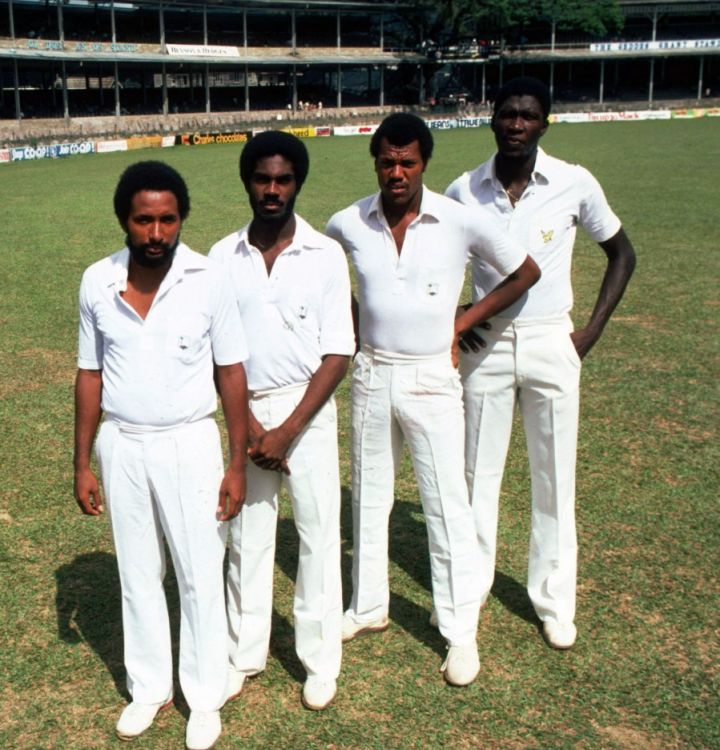
On December 1, 1979, West Indies trooped out to play Australia in a series featuring two of the top teams in the world back at full strength. It was the first time the top players were returning to the national teams after the Kerry Packer World Series, but for West Indies it was another historic first: their bowling attack, for the very first time, comprised these four names - Andy Roberts, Michael Holding, Joel Garner, Colin Croft. Roberts had already played 27 Tests then, and had an average of 24.61, but the others were relatively raw. Holding had played 13 Tests, but had already made a name for himself with 57 wickets, while Garner and Croft had played seven Tests each, taking 38 and 42 wickets. (Croft's haul included 8 for 29 against Pakistan in only his second Test, which remain the best figures by a West Indian fast bowler in Tests.) West Indies had already produced one great fast bowler, Wes Hall, but over the next decade and a half, opposing batsmen would face an examination like never before from a relentless battery of bowlers who possessed fiery pace, skill, and sustained aggression.
To return to the first Test of that 1979 series at the Gabba, West Indies chose to field, bundled Australia out for 268, and then notched up 441 themselves. In the second innings, though, Australia didn't roll over, facing 166 overs and racking up 448 for 6 declared, with centuries for Greg Chappell and Kim Hughes. That Test was drawn, but no team would last as many overs against West Indies for the next seven years.
For Australia that second-innings display was the high point of their series, for they were resoundingly beaten - by 10 wickets and 408 runs - in the next two Tests, with totals of 156, 259, 203 and 165 in those four innings. The West Indian pace juggernaut, which had briefly been halted by the Kerry Packer years, was well and truly on its way: over the next decade and a half, they played 31 series (including the one in 1979 against Australia), won 21, drew nine, and lost just one, quite controversially to New Zealand in 1980.
During this period West Indies won 61 Tests and lost 16. Add the couple of years pre-Packer when they played with a largely pace-centric attack, between 1976 and 1978, and their win-loss ratio added up to 70-18, which was more than twice that of the next best side, Pakistan (3.89 to 1.76). West Indies' bowling was quite clearly the best too, with an average of less than 26. Not surprisingly, pace accounted for 91.63% of the wickets taken by their bowlers (2070 out of 2284), at an average of less than 24.
What's also remarkable about the West Indies numbers is the relatively low five- and ten-wicket hauls - there were so many great bowlers in the attack that there was seldom the opportunity for one bowler to run through a batting line-up. There were only 12 ten-fors, which is half as many as Australia managed, and nine fewer than Pakistan.
| Team | Tests | W/ L | Wickets | Average | 5WI/ 10WM | Pace - wkts | Average | Strike rate |
| West Indies | 137 | 70/ 18 | 2284 | 25.89 | 88/ 12 | 2070 | 23.87 | 53.1 |
| Pakistan | 133 | 44/ 25 | 1990 | 29.42 | 101/ 21 | 1286 | 27.63 | 58.8 |
| Australia | 171 | 57/ 51 | 2598 | 31.41 | 120/ 24 | 1889 | 29.78 | 62.5 |
| India | 132 | 28/ 37 | 1794 | 34.09 | 82/ 11 | 789 | 34.13 | 69.4 |
| New Zealand | 109 | 24/ 38 | 1452 | 34.04 | 74/ 14 | 1133 | 31.56 | 67.7 |
| England | 182 | 41/ 70 | 2518 | 34.78 | 103/ 10 | 1947 | 32.85 | 68.9 |
| Sri Lanka | 58 | 4/ 27 | 674 | 39.22 | 25/ 0 | 446 | 36.39 | 70.8 |
# The period between Apr 1978 and Nov 1979
Quite amazingly seven West Indian fast bowlers took 50-plus wickets at sub-25 averages during this period. Ian Bishop played only 18 Tests in this era, but he achieved amazing numbers, averaging just over 20 and taking a wicket every 47 deliveries. Malcolm Marshall achieved similar numbers playing more than four times as many matches, which, in a nutshell, indicates just how good he was. Garner played all of 58 Tests without once taking 10 in a match, and taking only seven five-fors. That, perhaps, is the best illustration of how good West Indies' attack was, for Garner finished his career with 259 wickets at less than 21 apiece. In fact, Marshall, Garner and Curtly Ambrose are the only three in the history of Test cricket to take more than 200 wickets at averages of less than 21.
| Bowler | Tests | Wickets | Average | Strike rate | 5WI/ 10WM |
| Ian Bishop | 18 | 83 | 20.45 | 47.1 | 5/ 0 |
| Malcolm Marshall | 81 | 376 | 20.94 | 46.7 | 22/ 4 |
| Joel Garner | 58 | 259 | 20.97 | 50.8 | 7/ 0 |
| Curtly Ambrose | 50 | 224 | 21.11 | 54.2 | 11/ 3 |
| Michael Holding | 55 | 239 | 22.10 | 48.3 | 13/ 2 |
| Colin Croft | 27 | 125 | 23.30 | 49.3 | 3/ 0 |
| Courtney Walsh | 70 | 255 | 24.77 | 56.6 | 9/ 2 |
| Winston Benjamin | 17 | 52 | 26.09 | 59.8 | 0/ 0 |
| Andy Roberts | 34 | 133 | 26.78 | 58.1 | 6/ 1 |
| Pattrick Patterson | 28 | 93 | 30.90 | 51.9 | 5/ 0 |
Perhaps the most impressive aspect of the West Indies pace attack was the manner in which they dominated in every country they played in. In fact, nowhere did they concede more than 26 runs per wicket. Even on the slow wickets of India, they averaged 25.41, and their strike rate there was the best among all countries. They were at their best in the 1983-84 six-Test series. Still smarting from the defeat in the World Cup final earlier in the year, they destroyed India's famed batting line-up, taking 97 wickets in six Tests at an average of 24.65. Marshall was the star of that series, with 33 wickets at 18.81, while Holding wasn't far behind, taking 30 wickets at 22.10. In fact, the 97 wickets they took remained their biggest haul in a single series.
They were even more lethal in Pakistan, taking 44 wickets in three Tests in 1986-87, and 54 in four at 19.53 in 1980-81. In fact, in the 35 series that West Indies played during this period, only twice did their pace attack concede more than 30 runs per wicket - against Pakistan at home in 1987-88 and against India in 1975-76.
The team they played most often against, though, were England, and the fast bowlers were exceptional in each series they played against them. They were at their best in the 5-0 drubbing in 1985-86, when five Tests fetched the fast bowlers 94 wickets at 19.54. When they toured England, West Indies' fast men were no less lethal, as these stats will testify: 88 wickets at 21.01 (1976), 85 at 20.24 (1988), 81 at 21.48 (1984), 81 at 25.27 (1980), and 81 at 25.56 (1991). (Click here for the full list of series-wise performances by West Indies' fast bowlers during this period.)
Individually there were 19 instances of a fast bowler taking 25 or more wickets in a series. Marshall and Garner led the way, achieving it five times each, while Ambrose did it four times. (Click here to check out the highest individual wicket-takers among these fast bowlers in a series.)
| Host country | Tests | Wickets | Average | Strike rate | Win/ loss |
| Sri Lanka | 1 | 9 | 15.33 | 49.6 | 0/ 0 |
| Pakistan | 10 | 142 | 19.52 | 46.8 | 3/ 2 |
| England | 25 | 416 | 22.66 | 54.5 | 15/ 2 |
| West Indies | 59 | 877 | 24.29 | 52.6 | 34/ 6 |
| Australia | 21 | 327 | 25.02 | 56.1 | 11/ 4 |
| New Zealand | 8 | 102 | 25.37 | 60.6 | 2/ 2 |
| India | 13 | 197 | 25.41 | 48.0 | 5/ 2 |
West Indies had such an abundance of fast-bowling talent in the late 1970s and the 1980s that it was impossible to accommodate all of them in an XI. Here's a look at how many matches some of the legends of the game played together (with a cut-off of 10 Tests for four of them playing together, and 20 Tests for three), their performances and the team results in those matches:
Among the individual bowlers, Garner and Holding were the most effective in those 11 matches, averaging around 20, while Roberts was the most disappointing, taking only 28 wickets. Croft's decision to be a part of the rebel tour to South Africa in 1983 ended that four-man partnership relatively early.
| Bowler | Tests | Wickets | Average | Strike rate | Econ rate | 5WI/ 10Wm |
| Joel Garner | 11 | 47 | 19.48 | 55.8 | 2.09 | 2/ 0 |
| Michael Holding | 11 | 51 | 20.56 | 45.7 | 2.69 | 4/ 1 |
| Colin Croft | 11 | 46 | 25.82 | 54.7 | 2.83 | 2/ 0 |
| Andy Roberts | 11 | 28 | 35.53 | 84.6 | 2.51 | 0/ 0 |
| All together | 11 | 172 | 24.12 | 57.27 | 2.53 | 8/ 1 |
Marshall, Roberts, Garner and Holding played only six Tests together, with Roberts being the outstanding bowler in those matches, taking 33 wickets at 17.48. The results in those six matches were three wins, three draws.
| Bowler | Tests | Wickets | Average | Strike rate | Econ rate | 5WI/ 10WM |
| Joel Garner | 26 | 110 | 21.03 | 51.0 | 2.47 | 3/ 0 |
| Malcolm Marshall | 26 | 123 | 21.33 | 46.7 | 2.73 | 7/ 1 |
| Michael Holding | 26 | 98 | 25.63 | 53.3 | 2.88 | 3/ 0 |
| All together | 26 | 331 | 22.51 | 50.16 | 2.69 | 13/ 1 |
Marshall was in outstanding form in these 28 matches, averaging less than 20 for his 133 wickets, at a strike rate of 44.7. Overall these three bowlers accounted for 12 wickets per match in these 28 Tests, at an average not far off the one achieved by the previous trio.
| Bowler | Tests | Wickets | Average | Strike rate | Econ rate | 5WI/ 10WM |
| Malcolm Marshall | 28 | 133 | 19.17 | 44.7 | 2.57 | 8/ 2 |
| Curtly Ambrose | 28 | 118 | 23.77 | 58.2 | 2.45 | 4/ 0 |
| Courtney Walsh | 28 | 87 | 28.26 | 65.5 | 2.58 | 1/ 1 |
| All together | 28 | 338 | 23.12 | 54.81 | 2.53 | 13/ 3 |
| Bowler | Tests | Wickets | Average | Strike rate | Econ rate | 5WI/ 10WM |
| Curtly Ambrose | 37 | 139 | 22.25 | 54.8 | 2.43 | 9/ 1 |
| Ian Bishop | 37 | 138 | 24.24 | 51.3 | 2.83 | 6/ 0 |
| Courtney Walsh | 37 | 135 | 25.26 | 56.4 | 2.68 | 6/ 1 |
| All together | 37 | 412 | 23.91 | 54.23 | 2.65 | 21/ 2 |
(The three tables above were for combinations where the three fast bowlers played together in at least 20 Tests. There were three other combinations that deserve to be mentioned: Croft, Garner, Roberts played 18 Tests together, of which West Indies won nine and lost two; Roberts, Holding, Garner played 17 Tests together, of which West Indies won eight and lost one; and Holding, Garner, Croft played 16 Tests, of which West Indies won five and lost two.)
And finally, a look at the batsmen who faced them better than the rest. Only eight batsmen scored more than 1000 Test runs against them, and none averaged more than 46. Sunil Gavaskar tops the averages, and what stood out was his ability to convert his starts into big scores. His best series against West Indies, though, were when these fast bowlers weren't around - he averaged 154.80 in 1971, and 91.50 in the home series in 1978-79, when West Indies' main fast bowlers were away, playing for Packer. Graham Gooch was probably the most consistent, with 18 scores of 50-plus in 51 innings. Allan Lamb scored more centuries against this attack than anyone else, but he also had a number of low scores, due to which his overall average against them is less than 35.
| Batsman | Tests | Runs | Average | 100s/ 50s |
| Sunil Gavaskar | 15 | 1135 | 45.40 | 5/ 2 |
| Graham Gooch | 26 | 2197 | 44.83 | 5/ 13 |
| Robin Smith | 15 | 1028 | 44.69 | 3/ 6 |
| David Boon | 18 | 1285 | 42.83 | 3/ 7 |
| Dilip Vengsarkar | 19 | 1179 | 40.65 | 4/ 6 |
| Allan Border | 31 | 2052 | 39.46 | 3/ 14 |
| Allan Lamb | 22 | 1342 | 34.41 | 6/ 2 |
| David Gower | 19 | 1149 | 32.82 | 1/ 6 |
Apart from their exploits in Test cricket, West Indies' pace attack also left their mark on World Series Cricket, and in ODIs. West Indies were by far the most successful ODI side till the end of the 1980s, and their fast bowlers were among the best, both in terms of averages and economy rates. In a nutshell, when these special West Indian fast men had the ball in hand, the format, the venue, the conditions, and the batsmen ceased to matter.
S Rajesh is stats editor of ESPNcricinfo
Read in App
Elevate your reading experience on ESPNcricinfo App.