Smith twice as good as Australia's next best
Given how keenly the Border-Gavaskar Trophy was contested, it is of no surprise that the key numbers between the two sides stack up in similar fashion
S Rajesh
Mar 29, 2017, 7:35 AM
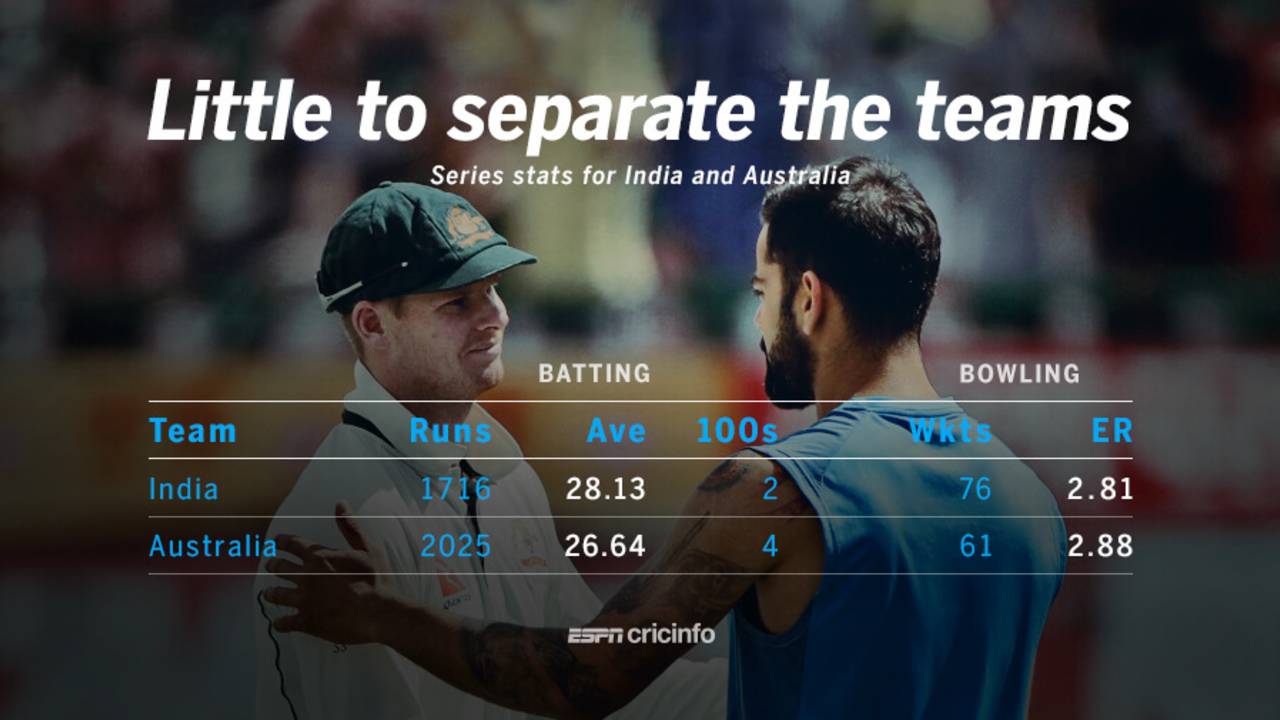
The difference between the batting averages of India and Australia in the series was only 1.49 • ESPNcricinfo Ltd
1.49 The difference in averages between the two teams: India averaged 28.13 runs per wicket to Australia's 26.64. The miniscule difference in average illustrates how close the series was. Australia scored more runs and hundreds, but India took more wickets. Both teams bowled superbly and made run-scoring extremely difficult for the opposition batsmen, which is illustrated in run-rates of under 2.9 for both teams. The minimal difference in averages was in sharp contrast to the differences in the three other Test series in India's season - the difference was 17.35 in the India-England series, 25.09 in the India-New Zealand series, and 52.7 in the one-off Test against Bangladesh.
50.66 India's average partnership for the seventh wicket, compared to Australia's 23.57. In a low-scoring and hard-fought series, the seventh-wicket stands made a huge difference in the last two Tests, with Cheteshwar Pujara and Wriddhiman Saha adding 199 in Ranchi, and Saha and Ravindra Jadeja adding 96 in Dharamsala. On both occasions, those partnerships helped India take first-innings leads and put Australia under pressure. There was little to choose between the average stands for the first six wickets - India's was 33.18, and Australia's 33.62. Australia had 13 fifty-plus stands for the first six wickets compared to India's eight.
| India | Australia | |||
| Wkt | Ave stand | 100/50 p'ships | Ave stand | 100/50 p'ships |
| 1st | 34.85 | 0/ 1 | 31.62 | 0/ 3 |
| 2nd | 45.57 | 1/ 2 | 36.37 | 1/ 0 |
| 3rd | 36.00 | 0/ 1 | 24.87 | 0/ 1 |
| 4th | 29.83 | 0/ 2 | 26.37 | 0/ 3 |
| 5th | 43.66 | 1/ 0 | 54.12 | 2/ 1 |
| 6th | 6.83 | 0/ 0 | 28.37 | 0/ 2 |
| 7th | 50.66 | 1/ 1 | 23.57 | 0/ 0 |
22 Wickets taken by the pace bowlers of each team; India's pace attack averaged 30.68, compared to Australia's 31.54. Umesh Yadav was the stand-out fast bowler from either team, taking 17 wickets at 23.41. None of the Australian fast bowlers averaged below 30.
| Pace | Spin | |||||
| Team | Wkts | Ave | SR | Wkts | Ave | SR |
| India | 22 | 30.68 | 61.7 | 52 | 24.13 | 56.9 |
| Australia | 22 | 31.54 | 66.2 | 38 | 24.73 | 55.5 |
25.26 Nathan Lyon's bowling average in the series, which was marginally better than that of India's offspinner, R Ashwin (27.38). In the first innings, Lyon took 15 wickets at 21.73, compared to Ashwin's seven wickets at 45. In the second innings, though, Ashwin was much better, taking 14 wickets at 18.57, to Lyon's four wickets at 38.50.
22.71 Ravindra Jadeja's average in the first-innings, in which he took 14 wickets at a strike rate of 47.2. Among the four leading spinners in the series, Jadeja had the best overall numbers too, taking 25 wickets at 18.56.
| 1st inngs | 2nd inngs | |||||
| Bowler | Wkts | Ave | SR | Wkts | Ave | SR |
| Nathan Lyon | 15 | 21.73 | 45.4 | 4 | 38.50 | 79.2 |
| R Ashwin | 7 | 45.00 | 120.7 | 14 | 18.57 | 36.2 |
| Ravindra Jadeja | 14 | 22.71 | 47.2 | 11 | 13.27 | 56.1 |
| Steve O'Keefe | 11 | 31.72 | 75.3 | 8 | 11.62 | 30.7 |
2.15 Ratio of Steven Smith's series aggregate runs to that of the next highest for Australia. Smith scored 499 in the series, while Matt Renshaw's 232 was the next best. The ratio of 2.15 is the second-best for any overseas batsman in India in a series of three or more Tests, next only to Matthew Hayden's ratio of 2.25 over Steve Waugh in the 2001 series, when Hayden towered over the rest of Australia's batsmen. Ironically, Australia lost both these series by an identical 2-1 margin. Overall, there have been four instances of a batsman aggregating twice as many runs as the next-best team-mate, in a series of three or more Tests in India.
The head-to-head battles
120 Smith's average against Umesh: in 202 balls from Umesh, Smith scored 120 runs and was dismissed once. The bowler who fared best against Smith was Jadeja, dismissing him three times at an average of 40.66.
| Bowler | Runs | Balls | Dismissals | Average |
| R Ashwin | 132 | 215 | 2 | 66.00 |
| Ravindra Jadeja | 122 | 355 | 3 | 40.66 |
| Umesh Yadav | 120 | 202 | 1 | 120.00 |
16.6 Matt Renshaw's average against India's pace attack. He was dismissed three times by Umesh (average 16), and twice by Ishant Sharma (average 15). Renshaw was far more comfortable against India's spinners, averaging nearly 50 against them. He averaged 75 against Ashwin, and 57 against Jadeja.
6 Number of times David Warner was dismissed by India's spinners, in eight innings. Unlike Renshaw, Warner was far more comfortable against pace, averaging almost 40 against them, while his average dropped to less than 20 against spin. He was dismissed three times by Ashwin (average 22.33), and twice by Jadeja (average 13).
| Batsman | Bowler type | Runs | Balls | Dismissals | Average |
| David Warner | Pace | 78 | 107 | 2 | 39.00 |
| David Warner | Spin | 115 | 202 | 6 | 19.16 |
| Matt Renshaw | Pace | 83 | 226 | 5 | 16.60 |
| Matt Renshaw | Spin | 149 | 380 | 3 | 49.66 |
104 KL Rahul's average against Australia's pace attack - he scored 208 runs against them and was dismissed twice. Pat Cummins dismissed him both times, conceding 51 runs, but against Mitchell Starc and Josh Hazlewood, Rahul scored 156 runs without being dismissed.
1.34 Murali Vijay's scoring rate, in terms of runs per over, against Australia's pace attack: in 143 balls against them, he scored only 32 and was dismissed three times, for an average of 10.66. Vijay was more comfortable against the spinners, averaging 40.5 at a much healthier run rate.
| Batsman | Bowler type | Runs | Balls | Dismissals | Average |
| KL Rahul | Pace | 208 | 355 | 2 | 104.00 |
| KL Rahul | Spin | 185 | 343 | 4 | 46.25 |
| Murali Vijay | Pace | 32 | 143 | 3 | 10.66 |
| Murali Vijay | Spin | 81 | 153 | 2 | 40.50 |
117 Cheteshwar Pujara's average against Steve O'Keefe - he scored 117 runs off him from 342 balls, and was dismissed once. The only bowler who dismissed Pujara more than once in the series was Lyon, who got him out three times at an average of 37.
| Bowler | Runs | BF | Wkt | Ave |
| Steve O'Keefe | 117 | 342 | 1 | 117.00 |
| Nathan Lyon | 111 | 293 | 3 | 37.00 |
| Josh Hazlewood | 98 | 236 | 1 | 98.00 |
| Pat Cummins | 54 | 102 | 0 | - |
| Mitchell Starc | 15 | 40 | 1 | 15.00 |
S Rajesh is stats editor of ESPNcricinfo. @rajeshstats