Chasing glory
The best second-innings batsmen in ODIs, and those who've scored the highest percentage of team runs in an innings
If a poll were to be done asking batsmen if they prefer to bat first or second in ODIs, most will probably choose the former. Batting first, without being confronted with a target, usually frees the mind and allows batsmen to play their natural game. Plus, the pitch is usually at its best in the first half of the game. Most of the great ODI batsmen have done well in both situations, but two of the greatest have better numbers when batting first, even if the difference isn't a whole lot: Sachin Tendulkar averages more than 47 in the first innings, and 43 in the second. He's also scored 31 hundreds in the first innings, and 17 in the second. Similarly, Viv Richards averaged almost 49 and scored eight hundreds when batting first, and 44.92 with three centuries in chases. Michael Bevan had a higher average in the second innings - 56.50, to 51.66 when batting first - but that's partly because of his 30 not-outs in 81 second innings (compared with 37 in 115 when batting first). And even in his case, his strike rate in second innings (67.60) was much lower than that in the first (79.69).
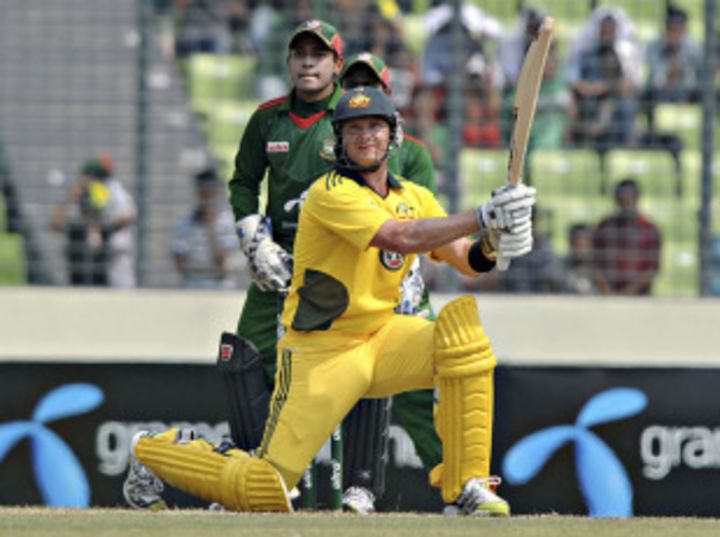
There are a few, though, who genuinely enjoy a run-chase far more than they do setting a target. The batsman with the biggest contrast in numbers is Australia's Shane Watson. After that brutal unbeaten 185 in Mirpur against Bangladesh, Watson had this to say about chasing: "It's always actually easier batting second. Although you do get pretty hot from bowling first, it means I can actually get through my batting innings knowing I don't have to bowl next and don't have to use my energy. So my preferred way of playing one-day cricket is actually batting second, because you don't need the energy. If it comes off like it did today, I don't have to run too much."
His stats bear out his preference for batting second - his average of 64.30 in run-chases is almost twice his first-innings average. Five of his six ODI centuries have come in chases, which makes his conversion rate outstanding - five hundreds out of 15 scores of 50-plus; in contrast, when batting first he has scored only one century and 13 fifties.
| Innings | Runs | Average | Strike rate | 100s/ 50s | |
| Batting first | 73 | 2008 | 33.46 | 89.88 | 1/ 13 |
| Batting second | 41 | 1929 | 64.30 | 89.30 | 5/ 10 |
| Career | 114 | 3937 | 43.74 | 89.59 | 6/ 23 |
The table below indicates Watson has been at his most dangerous in matches in which the opposition has won the toss and chosen to bat. In 30 such innings, Watson has scored four hundreds and averages 71.80. These hundreds include the three highest scores made by Australians in run-chases. Two of his four hundreds were in back-to-back games in the semi-finals and final of the Champions Trophy in 2009.
| Innings | Runs | Average | Strike rate | 100s/ 50s | |
| Won toss & batted | 46 | 1349 | 33.72 | 89.10 | 1/ 9 |
| Won toss & fielded | 11 | 421 | 46.77 | 85.39 | 1/ 2 |
| Lost toss & sent in | 27 | 659 | 32.95 | 91.52 | 0/ 4 |
| Lost toss & fielded | 30 | 1508 | 71.80 | 90.46 | 4/ 8 |
Among batsmen who've scored at least 1500 runs batting second, Watson's average of 64.30 is easily the highest. The list is dominated by Australians, with four in the top five, which is another reason why they've been so dominant in ODI cricket over the last couple of decades.
In fact, Watson is well on course to becoming the fastest to 2000 runs - in terms of innings batted - in run-chases. Currently, he has 1929 runs in 41 innings, and is 71 short of 2000. The best currently - in terms of fewest innings - is 49 innings, by Gordon Greenidge, which means Watson has seven innings in which to score 71 runs and own the record. On current form just one might be sufficient.
| Batsman | Innings | Runs | Average | Strike rate | 100s/ 50s | Inngs to reach 2000 |
| Shane Watson | 41 | 1929 | 64.30 | 89.30 | 5/ 10 | - |
| Michael Bevan | 81 | 2882 | 56.50 | 67.60 | 3/ 19 | 57 |
| Michael Clarke | 59 | 2055 | 55.54 | 75.19 | 3/ 16 | 59 |
| MS Dhoni | 81 | 2750 | 50.92 | 83.45 | 2/ 19 | 56 |
| Matthew Hayden | 62 | 2450 | 50.00 | 79.15 | 1/ 20 | 51 |
| Gautam Gambhir | 58 | 2418 | 49.34 | 86.91 | 5/ 15 | 51 |
| Gordon Greenidge | 73 | 2996 | 49.11 | 64.83 | 7/ 16 | 49 |
| Sunil Gavaskar | 48 | 1905 | 48.84 | 61.45 | 1/ 18 | - |
| AB de Villiers | 60 | 2262 | 48.12 | 88.46 | 3/ 16 | 55 |
| Tillakaratne Dilshan | 58 | 1919 | 47.97 | 91.68 | 5/ 5 | - |
Watson's second-innings average is about 92% better than his first-innings one - the difference is the highest among batsmen who've scored at least 1500 runs each in first and second innings. The list below is dominated by openers, which suggests that batting second is a good option for those who have the entire quota of overs to plan their chase. One opener who misses out despite having similar numbers is Sunil Gavaskar - he averaged 24.22 in the first innings and 48.84 in the second, a percentage difference of 101.65. That would have put him on top of the list, except he scored only 1187 runs in first innings, which keeps him out of the 1500-run cut-off.
| Batsman | 1st inng - runs | Average | 2nd inng - runs | Average | Difference | % diff |
| Shane Watson | 2008 | 33.46 | 1929 | 64.30 | 30.84 | 92.17 |
| Gautam Gambhir | 1655 | 32.45 | 2418 | 49.34 | 16.89 | 52.05 |
| Tillakaratne Dilshan | 3537 | 32.44 | 1919 | 47.97 | 15.53 | 47.87 |
| Michael Clarke | 4254 | 40.90 | 2055 | 55.54 | 14.64 | 35.79 |
| Andrew Strauss | 1962 | 31.14 | 2243 | 40.78 | 9.64 | 30.96 |
Watson's stunner in Mirpur shattered a number of records, but one of the less publicised ones was the percentage of the team's runs he scored. His 185 was almost 80% of Australia's total of 232: the highest in ODIs among team scores of at least 100. Richards is still on top of the table on this page, but that's only for completed innings (i.e, either the team was bowled out, or it played its entire quota of scheduled overs). In this case Australia batted just 26 overs, which, thanks to Watson, was enough for them to chase down the target of 230.
Watson's percentage of 79.74 is significantly better than Desmond Haynes' 72.65 when he scored 85 out of 117 against New Zealand. Ramiz Raja's unbeaten 119 out of 167 came in a World Cup match against New Zealand, and it sits at third place, though Ramiz's strike rate in that innings was only 76.77. However, Pakistan were chasing a low total, and Ramiz was helped by the fact that Javed Miandad, with whom he shared a partnership of 115, scored 30 from 85 balls.
Graeme Smith's unbeaten 134 came in an utter rout of India in Kolkata, when South Africa chased down 189 with all 10 wickets in hand and more than 14 overs to spare. Richards' unbeaten 189 out of 272 comes in next, and is the only one among the six that was a first-innings effort, and one in which the batting team played its full quota of overs.
| Batsman | Runs | Team score | Percentage | Opp, venue, year |
| Shane Watson | 185 | 232 | 79.74 | Bangladesh, Mirpur, 2011 |
| Desmond Haynes | 85 | 117 | 72.65 | New Zealand, Port of Spain, 1985 |
| Rameez Raja | 119 | 167 | 71.26 | New Zealand, Christchurch, 1992 |
| Graeme Smith | 134 | 189 | 70.90 | India, Kolkata, 2005 |
| Viv Richards | 189 | 272 | 69.49 | England, Old Trafford, 1984 |
| Gordon Greenidge | 133 | 192 | 69.27 | New Zealand, Christchurch, 1987 |
S Rajesh is stats editor of Cricinfo
Read in App
Elevate your reading experience on ESPNcricinfo App.