Openers on the back foot
The average opening partnership in Tests in 2011 is 31.70, which is easily the worst in the last 11 years
S Rajesh
23-Dec-2011
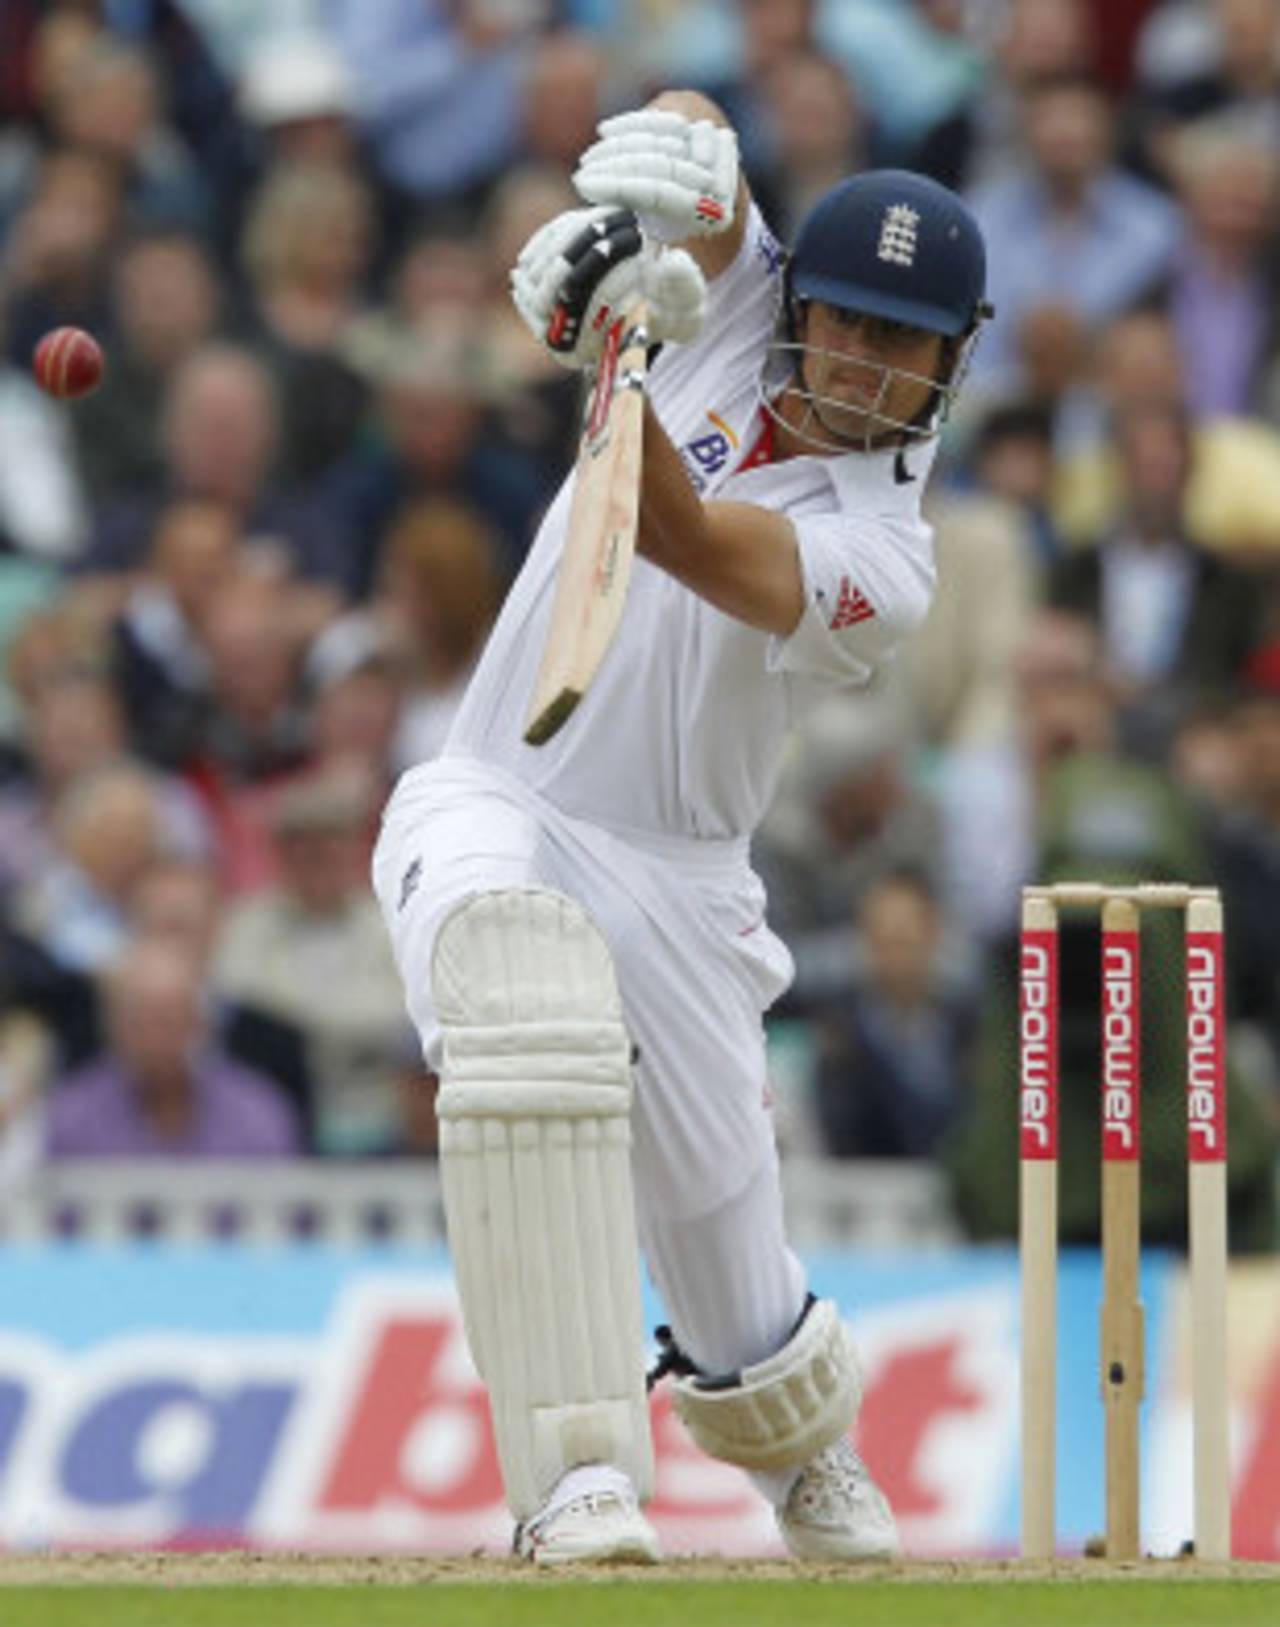
Alastair Cook: 927 runs at 84.27, but he was quite clearly the exception, not the rule • AFP
Name the only opening batting combination who batted together more than once in Tests in 2011 and managed a partnership average of 50 or more. It isn't an easy one to answer, for none of the regular pairs had a memorable 2011 in Test matches. The answer to the question comes later in the piece, but the obvious fallout of bowlers having a better-than-average year is that batting stats have suffered. However, openers have been impacted more than the rest, and even there the partnerships have been affected the most adversely.
Here's how. In 2011 the overall batting average for the top seven batsmen was 37, the second-lowest since the beginning of 2001; in 2009 and 2010, it had been greater than 41. The batting average of openers was 33.76, which was again well below the figure for the last couple of years, and the second-lowest in the last 11 years. However, the partnership average suffered more than any other stat. It's as if both openers just couldn't get starts and go on to make significant scores in the same innings - if one opener did well, the other failed. Imagine a scenario where one opener scores 100 and the other 0, and another where both openers scored 50, and got out with the score on 100. In both cases, the average for the openers is 50, but in the first case the partnership average is 0, while in the second it's 100. The first scenario illustrates, roughly, what happened in 2011.
That becomes clear when the partnership stats are compared for the last 11 years: in 2009 the average opening stand was 44.41; with two Tests to go in 2011, the average this year has shrunk to 31.70, a drop of nearly 29%. It's also significantly lower than it has been in any other year since 2001: the next-lowest, as the table below shows, is 36.29, in 2006.
Only nine century partnerships were put together for the first wicket this year, but the biggest difference was the number of first-wicket failures: out of 139 innings, on 78 occasions the partnership didn't exceed 20, which is a percentage of 56. In the three preceding years, the corresponding percentage of failures was only 42. That's one more stat to suggest that the quality of fast bowling has been more incisive in 2011.
| Year | Innings | Runs | Ave stand | 100/ 50 stands | Inng per 100 |
| 2009 | 146 | 6262 | 44.41 | 12/ 34 | 12.17 |
| 2004 | 191 | 8150 | 44.05 | 24/ 27 | 7.96 |
| 2010 | 157 | 6730 | 43.98 | 19/ 38 | 8.26 |
| 2008 | 173 | 7276 | 42.54 | 19/ 31 | 9.11 |
| 2003 | 162 | 6766 | 42.28 | 16/ 25 | 10.13 |
| 2001 | 199 | 8086 | 41.89 | 25/ 27 | 7.97 |
| 2002 | 191 | 7404 | 40.45 | 15/ 42 | 12.73 |
| 2005 | 179 | 6876 | 39.06 | 13/ 40 | 13.77 |
| 2007 | 117 | 4311 | 38.15 | 9/ 18 | 13.00 |
| 2006 | 172 | 6061 | 36.29 | 10/ 32 | 17.20 |
| 2011 | 139 | 4343 | 31.70 | 9/ 22 | 15.44 |
The average partnerships for the top seven wickets in 2011 further illustrates how far off the boil the openers have been this year. The second-wicket average is almost 39, the third and the fourth in excess of 45, and even the fifth and sixth are more than 36. That leaves the opening pair battling with the seventh-wicket pair - the one that necessarily involves the No. 8 batsman. The openers just edge that one, the difference in averages being a miniscule 0.69. Century partnerships, though, were more frequent for the seventh wicket, coming once every 14.6 innings, compared to once every 15.4 for the openers.
On the other hand, this was a fair year for middle-order pairings. Their average of 46.25 puts them somewhere in the middle of the pile, but they're much better off than their 2008 counterparts, when the average had slumped to 37.87.
| Wicket | Innings | Runs | Ave stand | 100/ 50 stands |
| 1st | 139 | 4343 | 31.70 | 9/ 22 |
| 2nd | 138 | 5207 | 38.85 | 8/ 37 |
| 3rd | 135 | 6141 | 46.52 | 15/ 32 |
| 4th | 132 | 5794 | 45.98 | 20/ 20 |
| 5th | 126 | 4779 | 38.23 | 13/ 19 |
| 6th | 124 | 4258 | 36.08 | 10/ 25 |
| 7th | 117 | 3451 | 31.09 | 8/ 15 |
And now for the answer to the question posed at the beginning of the piece: the only opening pair who batted together in more than one Test innings and put together an average partnership of 50 or more was the Zimbabweans Tino Mawoyo and Vusi Sibanda: in six innings they added exactly 300, at an average of 50. Admittedly, 171 of those runs came in two innings against Bangladesh, but it's still a fine achievement for a side that returned to the Test arena this year after a long absence.
Most of the other pairs were stuck in the early 40s, late 30s, or even lower. Pakistan's Mohammad Hafeez and Taufeeq Umar both had superb years as batsmen: they were among the top three run scorers for openers, and averaged more than 40 in Tests, but in the 19 innings in which they opened the batting, their average stand was only 32.61. They did put together two century partnerships - they were the only opening pair to do so in Tests this year - but on 14 occasions they were separated before they touched 25, and nine of these were single-digit stands. Consistency as a pair was clearly not their strong point in 2011.
Some other regular pairs had less than prolific years too, including those from Australia, Sri Lanka and India. Shane Watson and Phillip Hughes averaged almost 40 but had only once century stand in 11 innings, though that knock was a mighty effort of 174 in Johannesburg and helped Australia bounce back from the embarrassment of Cape Town. Exclude that one innings, though, and their average partnership falls to 26.40. Tillakaratne Dilshan and Tharanga Paranavitana were extremely inconsistent too - eight of their 11 stands were of 11 runs or fewer - while Gautam Gambhir and Virender Sehwag didn't get a single century stand in nine innings this year, after notching up four in 18 in 2010.
Thanks to Alastair Cook's phenomenal run this year - he scored 927 runs at 84.27 - England's opening stand averaged 42.63. It would have been even higher had Andrew Strauss been in better form: he managed only 316 runs in 11 innings, at an average of less than 29.
| Pair | Innings | Runs | Ave stand | 100/ 50 stands |
| Hafeez-Taufeeq | 19 | 587 | 32.61 | 2/ 2 |
| Cook-Strauss | 11 | 469 | 42.63 | 1/ 2 |
| Hughes-Watson | 11 | 438 | 39.81 | 1/ 3 |
| Dilshan-Paranavitana | 11 | 419 | 38.09 | 1/ 2 |
| Gambhir-Sehwag | 9 | 349 | 38.77 | 0/ 4 |
| Mawoyo-Sibanda | 6 | 300 | 50.00 | 1/ 2 |
| Guptill-McCullum | 8 | 268 | 33.50 | 1/ 0 |
| Rudolph-Smith | 5 | 203 | 40.60 | 0/ 1 |
| Paranavitana-Thirimanne | 8 | 184 | 26.28 | 0/ 1 |
| Kayes-Tamim | 6 | 176 | 29.33 | 0/ 1 |
| Mukund-Vijay | 6 | 55 | 9.16 | 0/ 0 |
The team-wise opening partnership stats show that only two sides managed more than 40 runs per dismissal at the top of the order in 2011: Zimbabwe and England, who averaged 42.63. Last year six teams had achieved that feat, which shows how sharp the decline has been in 2011. India, who topped the table in 2010 averaging 59.30, dropped to third from bottom in 2011, above only Bangladesh and West Indies.
It wasn't a memorable year for openers (save one named Alastair Cook), but for all those who relish a good contest between fast bowlers and opening batsmen, they'll want more of the same in 2012.
S Rajesh is stats editor of ESPNcricinfo. Follow him on Twitter