Which teams are the worst travellers?
A look at how Australia, South Africa and England have fared in Asia, and vice versa
S Rajesh
10-Feb-2012
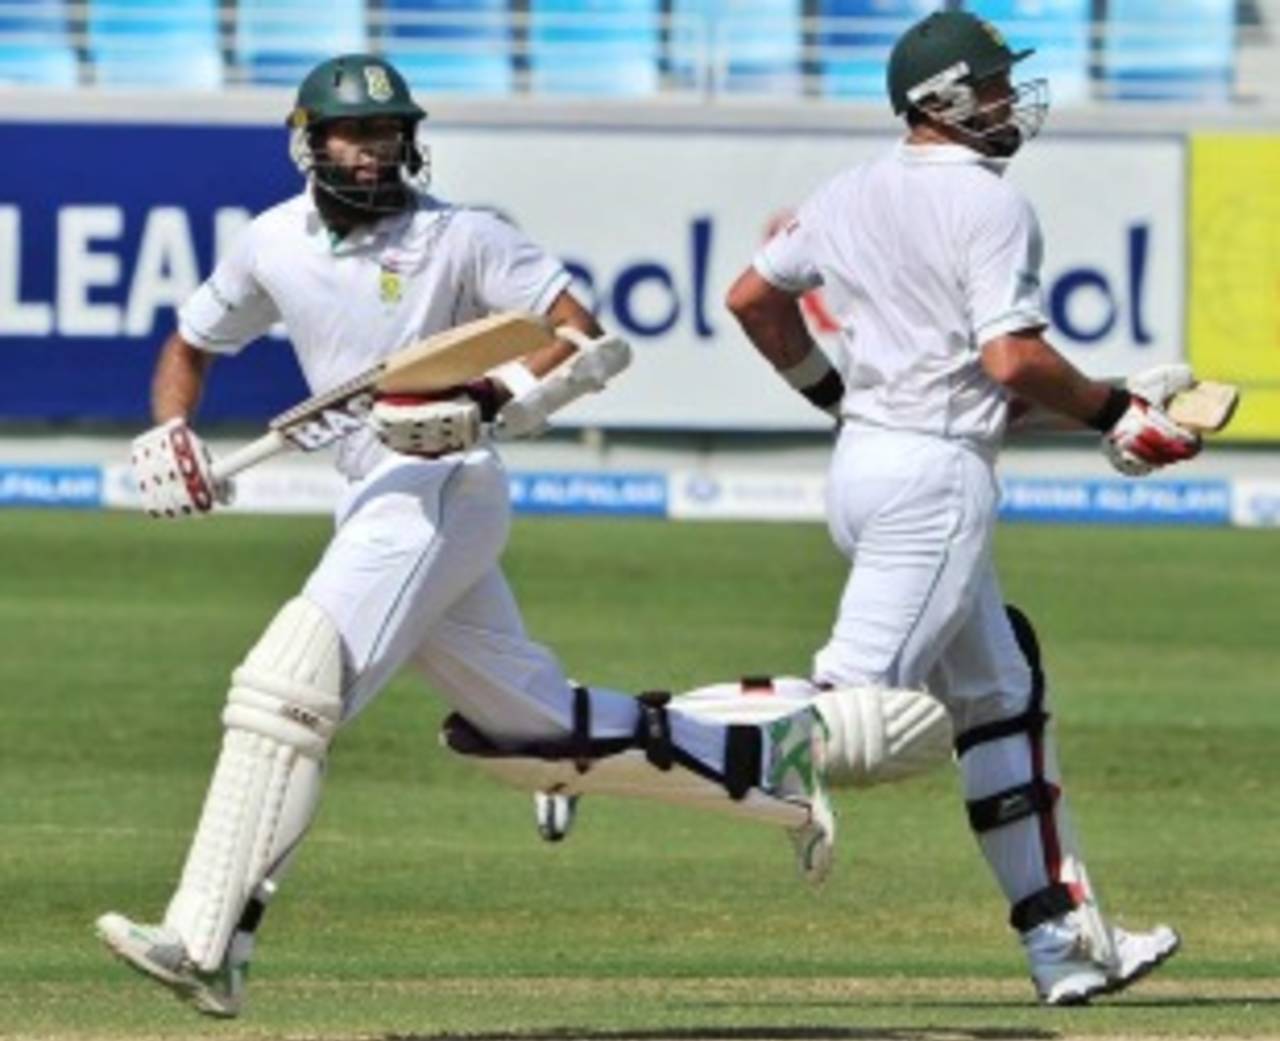
Hashim Amla and Jacques Kallis have outstanding numbers in Asia • AFP
The last seven months have been terrible ones for touring teams in Test cricket. India have lost eight Tests in a row - four each in England and Australia - while Sri Lanka have lost two out of three; England, meanwhile, lost all three in the UAE to Pakistan. The only team to escape the drubbing was Australia: they won their three-Test series against Sri Lanka 1-0.
Traditionally, tours to Australia, South Africa and England have been the toughest ones for teams from the subcontinent; conversely, tours to Asia have been the most difficult ones for the others. Is it true that teams from the subcontinent are worse travellers than the sides from Australia, South Africa and England? Here's a look at the numbers.
For the purpose of this exercise, only three teams each were considered from within and outside the subcontinent. Bangladesh's terrible record in Test cricket disqualifies them immediately, while New Zealand and West Indies have also struggled in Tests over the last few years, no matter where they've travelled. That leaves India, Pakistan and Sri Lanka as the subcontinent teams, and Australia, England and South Africa as the sides from outside the subcontinent. The time period considered for the exercise is since the beginning of 2005 - long enough for teams to have toured each of the other countries at least once, and also the period during which Australia's overwhelming dominance overseas had come to an end. In the five years between 2000 and 2004, for example, Australia had a 9-3 win-loss record in Asia; since then, it has dropped to 1-4 in nine Tests.
The overall numbers since the beginning of 2005 show that the top teams from outside the subcontinent have had as much trouble in Asia as the subcontinental teams have had overseas. Australia, England and South Africa have drawn more Tests, but the win-loss ratio is almost the same: 0.28 for the subcontinent teams, and 0.31 for the overseas team in Asia. Between 2000 and 2004, however, the overseas teams had a much better record in Asia: 15 wins and only ten defeats. Australia had their imposing 9-3 record, and even England (3-3) and South Africa (3-4) did better. On the other hand, the subcontinent teams had a worse record between 2000 and 2004, with a 3-16 win-loss ratio.
| Teams | Hosts | Tests | Won | Lost | Drawn | W/L ratio |
| Aus, Eng, RSA | Ind, Pak, SL, UAE | 34 | 5 | 16 | 13 | 0.31 |
| Ind, Pak, SL | Aus, Eng, RSA | 49 | 9 | 32 | 8 | 0.28 |
The win-loss ratios are almost the same, but in terms of batting and bowling averages the differences are huge: the gap between the two averages is significantly more for the teams from the subcontinent, compared to that for the overseas teams touring Asia. The main difference is in the batting averages: the unfamiliarity with bouncy pitches and seaming conditions is a clear disadvantage for the teams from the subcontinent - they average 27.48 per wicket when they tour Australia, South Africa and England. In contrast, when those teams tour Asia, their batting average is a respectable 34.37. The batting averages also conform to the theory that it's much tougher to adjust to higher bounce than to pitches with lower bounce.
The huge difference in the averages, despite the close win-loss ratio, also suggests that the margins of defeats for the teams from the subcontinent are much greater. In the period under consideration, India, Sri Lanka and Pakistan have lost ten of those 32 Tests by an innings, four by more than 290 runs, and three by nine or more wickets. The victory margins, on the other hand, have been much narrower. India alone have lost by an innings five times during this period. (Click here for the full list of results.)
Australia, South Africa and England haven't been blown away as often when they tour Asia. They've lost thrice by an innings, but have also won a couple of times by that margin (both by South Africa, against India). (Click here for their full list of results.)
| Teams | Hosts | Batting ave | Bowling ave | Difference |
| Aus, Eng, RSA | Ind, Pak, SL, UAE | 34.37 | 39.17 | -4.80 |
| Ind, Pak, SL | Aus, Eng, RSA | 27.48 | 40.79 | -13.31 |
Breaking it up further by teams, the difference between batting and bowling averages is greatest for Sri Lanka, despite them having the best win-loss ratio among the three teams. That's again because of the margins by which they've lost some of their matches. The bowling has been their chief cause for concern: they've conceded nearly 50 runs per wicket. India's difference isn't as high, despite the drubbings in England and Australia, while Pakistan's difference is the smallest, thanks to a bowling attack that is significantly better than those of India and Sri Lanka.
| Team | Tests | W/L/D | W/L ratio | Bat ave | Bowl ave | Diff |
| Sri Lanka | 11 | 2/6/3 | 0.33 | 28.76 | 49.95 | -21.19 |
| India | 21 | 4/13/4 | 0.30 | 28.47 | 41.64 | -13.17 |
| Pakistan | 17 | 3/13/1 | 0.23 | 25.35 | 35.83 | -10.48 |
Among overseas teams in Asia, South Africa are the only ones with a positive difference between batting and bowling averages. Their batting numbers clearly reveal that they, more than any other side, have best figured out how to play on slow pitches and in turning conditions. England's batsmen, on the other hand, have struggled, even though their bowlers have done pretty well.
| Team | Tests | W/L/D | W/L ratio | Bat ave | Bowl ave | Diff |
| South Africa |
11 | 3/4/4 | 0.75 | 42.61 | 41.43 | 1.18 |
| Australia | 9 | 1/4/4 | 0.25 | 34.71 | 40.35 | -5.64 |
| England | 14 | 1/8/5 | 0.12 | 28.68 | 36.77 | -8.09 |
And here's a further break-up of the batting numbers by pace and spin. The difference is the largest for India, which justifies the policy of unleashing four fast bowlers against them - spinners average almost 50 runs per wicket against them, while fast bowlers average less than 24. The numbers for Pakistan are slightly unexpected - spinners have done better against them than fast bowlers, even in conditions that should have generally favoured quick bowling. (Click here to see the list of spinners who've been among the wickets against Pakistan.)
The challenge for visiting teams in Asia is spin bowling, but England seem to struggle equally against pace too, averaging just 27.89 against them. South Africa's batsmen average more than 50 against pace, and a respectable 36 against spin.
| Team | Pace - Runs | Dismissals | Average | Spin - Runs | Dismissals | Average |
| Sri Lanka | 4235 | 163 | 25.98 | 1250 | 37 | 33.78 |
| India | 7789 | 328 | 23.74 | 2536 | 51 | 49.72 |
| Pakistan | 5477 | 209 | 26.20 | 1941 | 89 | 21.80 |
| Team | Pace - Runs | Dismissals | Average | Spin - Runs | Dismissals | Average |
| South Africa | 2845 | 54 | 52.68 | 3815 | 106 | 35.99 |
| Australia | 2061 | 64 | 32.20 | 2918 | 84 | 34.73 |
| England | 3180 | 114 | 27.89 | 3450 | 129 | 26.74 |
Running the rule over the bowlers, it's clear that Sri Lanka need to find quality fast bowlers who'll excel in overseas conditions: their current lot concede almost 64 runs per wicket; it's their spinners who've succeeded in pulling it back a bit. Pakistan's fast bowlers are clearly the best of the lot, averaging 30.24 per wicket.
Among the overseas bowlers in Asia, England's are the best, both in terms of pace and spin. However, their batting has been so inept in Asia that their win-loss ratio is much worse than those of South Africa and Australia.
| Team | Pace - wkts | Average | Strike rate | Spin - wkts | Average | Strike rate |
| Sri Lanka | 57 | 63.82 | 106.30 | 52 | 34.23 | 69.29 |
| India | 205 | 36.97 | 65.96 | 100 | 45.40 | 80.15 |
| Pakistan | 181 | 30.24 | 57.36 | 75 | 44.72 | 85.80 |
| Team | Pace - wkts | Average | Strike rate | Spin - wkts | Average | Strike rate |
| South Africa | 107 | 35.69 | 63.82 | 44 | 47.54 | 100.16 |
| Australia | 96 | 35.21 | 74.94 | 36 | 50.75 | 82.53 |
| England | 137 | 33.70 | 70.82 | 65 | 41.67 | 83.57 |
And finally, here's a break-up of stats by Asian batsmen in Australia, England and South Africa since the beginning of 2005, overall and against fast bowling. As the table below shows, the numbers don't make impressive reading for most batsmen. Sachin Tendulkar averages almost 49 overall and 41.50 against pace, but the numbers are significantly lower for Rahul Dravid, VVS Laxman and Virender Sehwag. Younis Khan's success in his last two series, in England and South Africa, are reflected in his numbers below. Mohammad Yousuf had one exceptional series in England in 2006, and that helped lift his overall numbers during this period. Mahela Jayawardene's stats tell the story of his troubles outside the subcontinent, but Kumar Sangakkara has done much better.
| Batsman | Overall - runs | Dismissals* | Average | v pace - runs | Dismissals* | Average |
| Sachin Tendulkar | 1806 | 37 | 48.81 | 1328 | 32 | 41.50 |
| VVS Laxman | 1284 | 36 | 35.66 | 943 | 33 | 28.57 |
| Rahul Dravid | 1263 | 37 | 34.13 | 910 | 31 | 29.35 |
| Mohammad Yousuf | 1097 | 21 | 52.23 | 797 | 13 | 61.30 |
| Kumar Sangakkara | 844 | 20 | 42.20 | 647 | 15 | 43.13 |
| Salman Butt | 796 | 23 | 34.60 | 632 | 16 | 39.50 |
| Virender Sehwag | 758 | 28 | 27.07 | 617 | 23 | 26.82 |
| Imran Farhat | 714 | 29 | 24.62 | 647 | 23 | 28.13 |
| Sourav Ganguly | 698 | 18 | 38.77 | 458 | 14 | 32.71 |
| Younis Khan | 645 | 11 | 58.63 | 503 | 8 | 62.87 |
| Mahela Jayawardene | 632 | 21 | 30.09 | 487 | 21 | 23.19 |
| Tillakaratne Dilshan | 594 | 14 | 42.42 | 465 | 11 | 42.27 |
| Thilan Samaraweera | 591 | 15 | 39.40 | 435 | 12 | 36.25 |
| Gautam Gambhir | 525 | 18 | 29.16 | 434 | 15 | 28.93 |
Among overseas batsmen in Asia, the numbers for the three South Africans - Hashim Amla, Jacques Kallis and AB de Villiers - stand out. How England must wish for at least one batsman who could put up similar numbers in Asia.
| Batsman | Overall-runs | Dismissals* | Average | v spin - runs | Dismissals* | Average |
| Hashim Amla | 1228 | 15 | 81.86 | 737 | 8 | 92.12 |
| Jacques Kallis | 1127 | 13 | 86.69 | 720 | 11 | 65.45 |
| AB de Villiers | 1028 | 14 | 73.42 | 561 | 10 | 56.10 |
| Michael Hussey | 956 | 15 | 63.73 | 579 | 10 | 57.90 |
| Ian Bell | 805 | 26 | 30.96 | 391 | 17 | 23.00 |
| Kevin Pietersen | 759 | 26 | 29.19 | 410 | 14 | 29.28 |
| Paul Collingwood | 754 | 16 | 47.12 | 409 | 8 | 51.12 |
| Alastair Cook | 741 | 19 | 39.00 | 404 | 6 | 67.33 |
| Andrew Strauss | 683 | 19 | 35.94 | 393 | 10 | 39.30 |
| Graeme Smith | 666 | 15 | 44.40 | 321 | 10 | 32.10 |
| Ricky Ponting | 614 | 13 | 47.23 | 363 | 6 | 60.50 |
| Michael Clarke | 500 | 16 | 31.25 | 338 | 9 | 37.55 |
S Rajesh is stats editor of ESPNcricinfo. Follow him on Twitter