Struggles all round for West Indies
West Indies, staring at a 15th Test defeat to England since 2000, have serious problems to sort out on both the batting and bowling fronts
Madhusudhan Ramakrishnan
May 30, 2012, 6:36 AM
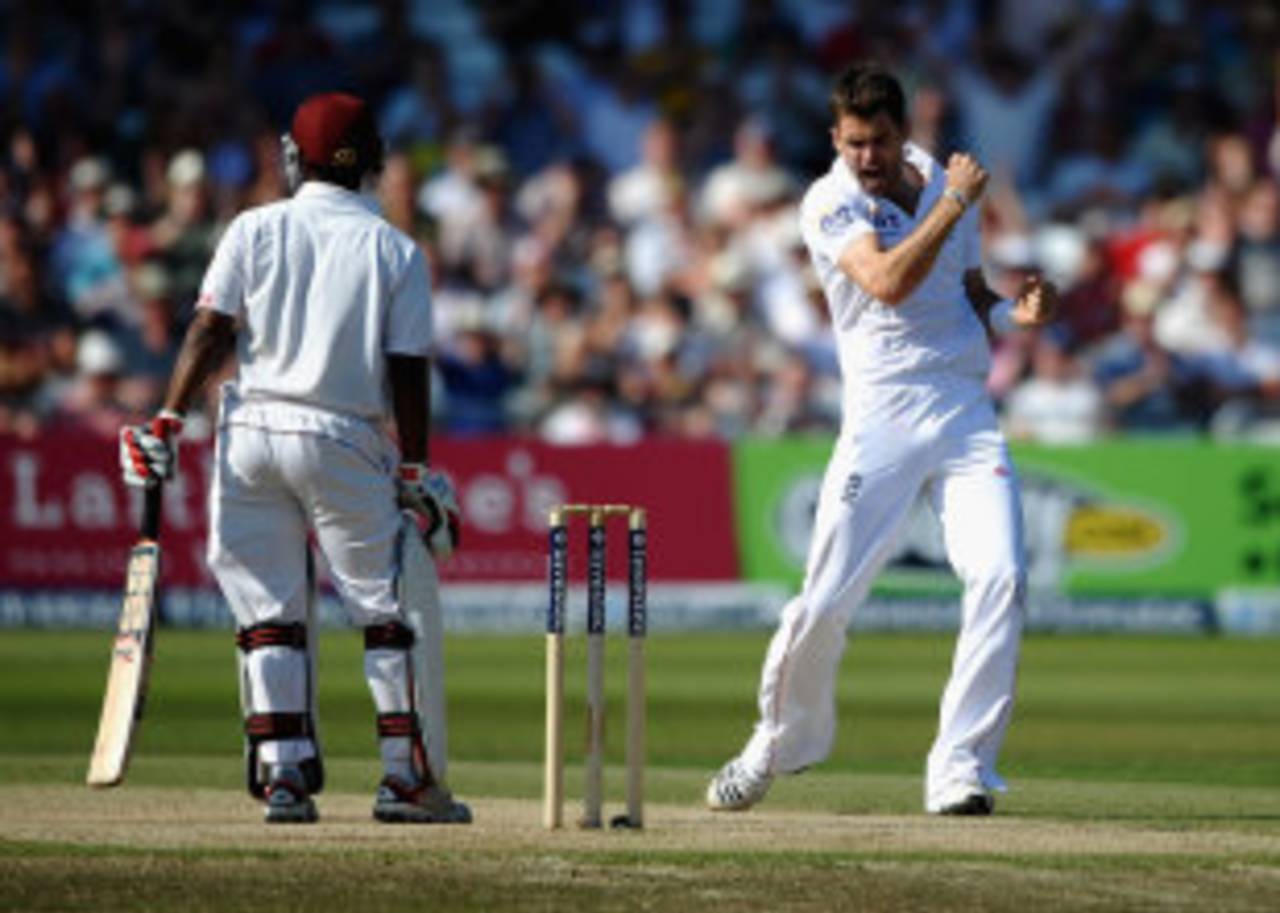
Since 2008, West Indies have employed 19 different opening combinations • Getty Images
Although they had produced a few encouraging performances in recent Tests, West Indies were hardly given a chance before the series against England started. After two Tests, all that remains to be seen is if West Indies can avoid another series whitewash. In the first Test at Lord's, they fought hard and briefly raised visions of an incredible upset but were unable to sustain the hostility in the second innings. At Trent Bridge, they were very much in the contest till another second-innings collapse ruined their chances. In recent series against India and Australia, West Indies have been undone more often than not because of ordinary batting displays in the second innings. In the first Test against India in Delhi, West Indies' collapse let India back into the contest after the hosts had conceded a 95-run lead. The tale of collapses continued in Kolkata (first-innings batting failure) and again in Mumbai, where they nearly lost again after crumbling for 134 in their second innings. What has really hurt West Indies has been the fact that they have been bowled out under 300 nine times and for sub-200 totals on five occasions in the last eight Tests.
Since 2005, West Indies' form in Tests has dropped exponentially. They have hardly managed to trouble a top Test team (excluding Bangladesh and Zimbabwe) and have only managed to register two wins in the last three years. The retirement of Brian Lara and the absence of Chris Gayle and Ramnaresh Sarwan has left them with a void too large to fill. Shivnarine Chanderpaul has fought a lone battle often home and away but has hardly found quality support. In home Tests, West Indies have managed a good average in both the first and second innings of matches (38.35 and 33.36 respectively) primarily because of the slow nature of the pitches in recent years. Their average in the third innings, however, falls away drastically to just 23.85. In the fourth innings, the average is higher but still below 30. In the team first innings (first and second match innings), they average 34.79 but a much lower average (27.05) in the team second innings (third and fourth match innings). In away Tests, the stats are even worse. They have managed a 30-plus average only in the first innings and struggled to perform as the matches progress. While their average in the team first innings in away Tests is acceptable (30.41), the corresponding number in the team second innings is disappointingly low (24.95). The overall figures are not too inspiring either with averages of 32.51 and 25.91 in the team first and second innings respectively.
* Only the table on opening-partnership stats includes all matches. All other tables exclude matches played against Bangladesh and Zimbabwe
| Venue | 1st innings | 2nd innings | 3rd innings | 4th innings | Team 1st innings | Team 2nd innings | Overall |
| Home tests | 38.35 | 33.36 | 23.85 | 29.03 | 34.79 | 27.05 | 31.50 |
| Away/neutral Tests | 33.43 | 26.95 | 24.60 | 26.08 | 30.41 | 24.95 | 27.97 |
| Overall | 35.05 | 30.69 | 24.38 | 28.11 | 32.51 | 25.91 | 29.62 |
Since 2008, England have risen to the top of the team rankings following a stunning run predominantly in home Tests. They have won eight of their last nine home series with only one defeat coming against South Africa in 2008. England and South Africa are the only two teams in the same period to average over 40 in the first innings. Sri Lanka, Australia and India are marginally behind, averaging between 39 and 40. West Indies' only consolation is that they have done better than Pakistan and New Zealand in the first innings. Most of the top teams have averages in the mid-30s in the second innings. However, South Africa have been extraordinary in the second innings with an average of 43.33. They remain the only team to have a higher average in the second innings than in the first. At the other end of the table, West Indies have the lowest average among all teams in the second innings and have been surpassed even by Pakistan and New Zealand.
* Includes only innings when team has been bowled out
| Team | Matches | 1st inns/2nd inns (avg) | Avg diff (1st and 2nd inns) | 1st inns/2nd inns (300-plus scores) | 1st inns/2nd inns (sub-200 scores) * |
| Australia | 80 | 39.31/32.83 | 6.48 | 34/17 | 5/5 |
| England | 87 | 40.66/34.03 | 6.63 | 35/9 | 6/6 |
| India | 74 | 39.26/34.59 | 4.67 | 30/10 | 4/4 |
| New Zealand | 45 | 29.08/27.49 | 1.59 | 10/6 | 10/7 |
| Pakistan | 58 | 29.90/28.73 | 1.17 | 13/6 | 7/5 |
| South Africa | 66 | 40.90/43.33 | -2.43 | 23/11 | 5/2 |
| Sri Lanka | 56 | 39.72/33.32 | 6.40 | 20/7 | 5/3 |
| West Indies | 64 | 31.53/27.26 | 4.27 | 17/10 | 6/9 |
A major problem for the West Indies has been the inability to find a settled opening pair. Since the beginning of 2011, with Gayle unavailable, the openers have usually failed. In the same period, West Indies have managed just one century stand against a top Test team but have 17 single-figure partnerships. In the past, a stable opening partnership was heavily responsible for the successful run of top teams like West Indies (1970s and 1980s) and Australia (1990s and 2000s). England, too, in the last few years, have had a solid opening pair of Andrew Strauss and Alastair Cook. Since 2005, West Indies have had the most opening combinations (19) among all teams. In sharp contrast, the highly-successful England team has had just four. West Indies have an average of just 28.26 for the first wicket with 15 fifty-plus stands. In the same period, only New Zealand (ten opening combinations) have a lower average (25.48) and fewer fifty-plus opening stands (nine).
| Team | Number of opening pairs | Average | 100/50 |
| Australia | 10 | 47.20 | 11/25 |
| England | 4 | 44.19 | 12/16 |
| India | 10 | 49.70 | 12/20 |
| New Zealand | 10 | 25.48 | 3/6 |
| Pakistan | 6 | 36.37 | 7/9 |
| South Africa | 10 | 49.07 | 7/21 |
| Sri Lanka | 9 | 32.86 | 3/16 |
| West Indies | 19 | 28.26 | 4/11 |
Unfortunately for West Indies, the problems don't just end on the batting front. They have often failed to drive home the advantage with the ball in the second innings. In the first Test at Lord's, they had no support for Kemar Roach, who bowled with aggression at the end of the fourth day. The lack of quality strike bowlers has meant that West Indies have hardly ever been able to finish matches despite being in a dominant position. In the first innings, most teams have managed to pick up wickets with Australia, England and South Africa having the highest value of wickets per innings. West Indies and Sri Lanka have wickets-per-innings values below nine. In the second innings, England lead the way with 8.06 wickets per innings followed closely by South Africa and Australia. India, who had two horror series in England and Australia, have very high averages in the first and second innings. However, by virtue of playing on spin-friendly tracks at home, they have managed a fairly high value of wickets per innings in the second innings. West Indies and New Zealand, in contrast, have struggled for consistency in the second innings. Both teams have managed under six wickets per innings with West Indies having the lowest value (5.75). West Indies are the only team to average more than 40 in both the first and second innings. A strong indicator of West Indies' struggles with the ball is the fact that they have managed to bowl out the opposition only seven times in the second innings in 37 matches.
| Team | Matches | 1st inns/2nd inns (avg) | Avg diff (1st and 2nd inns) | 1st inns/2nd inns (wickets/innings) | 1st inns/2nd inns (all ten wickets) |
| Australia | 54 | 33.16/32.45 | 0.71 | 9.79/8.00 | 49/30 |
| England | 50 | 31.20/30.95 | 0.25 | 9.82/8.06 | 46/26 |
| India | 48 | 45.23/39.38 | 5.85 | 9.02/7.78 | 35/22 |
| New Zealand | 30 | 36.30/39.02 | -2.72 | 9.73/5.76 | 27/9 |
| Pakistan | 29 | 33.30/31.91 | 1.39 | 9.62/7.70 | 25/16 |
| South Africa | 37 | 32.01/31.79 | 0.22 | 9.78/8.03 | 33/19 |
| Sri Lanka | 35 | 42.42/39.10 | 3.32 | 8.94/7.04 | 25/13 |
| West Indies | 37 | 44.64/41.01 | 4.63 | 8.70/5.75 | 23/7 |
Madhusudhan Ramakrishnan is a sub-editor (stats) at ESPNcricinfo