Spin torment continues for West Indies
West Indies impressed with both bat and ball in patches but were undone at the vital moments by their inept handling of the India spinners
Madhusudhan Ramakrishnan
27-Nov-2011
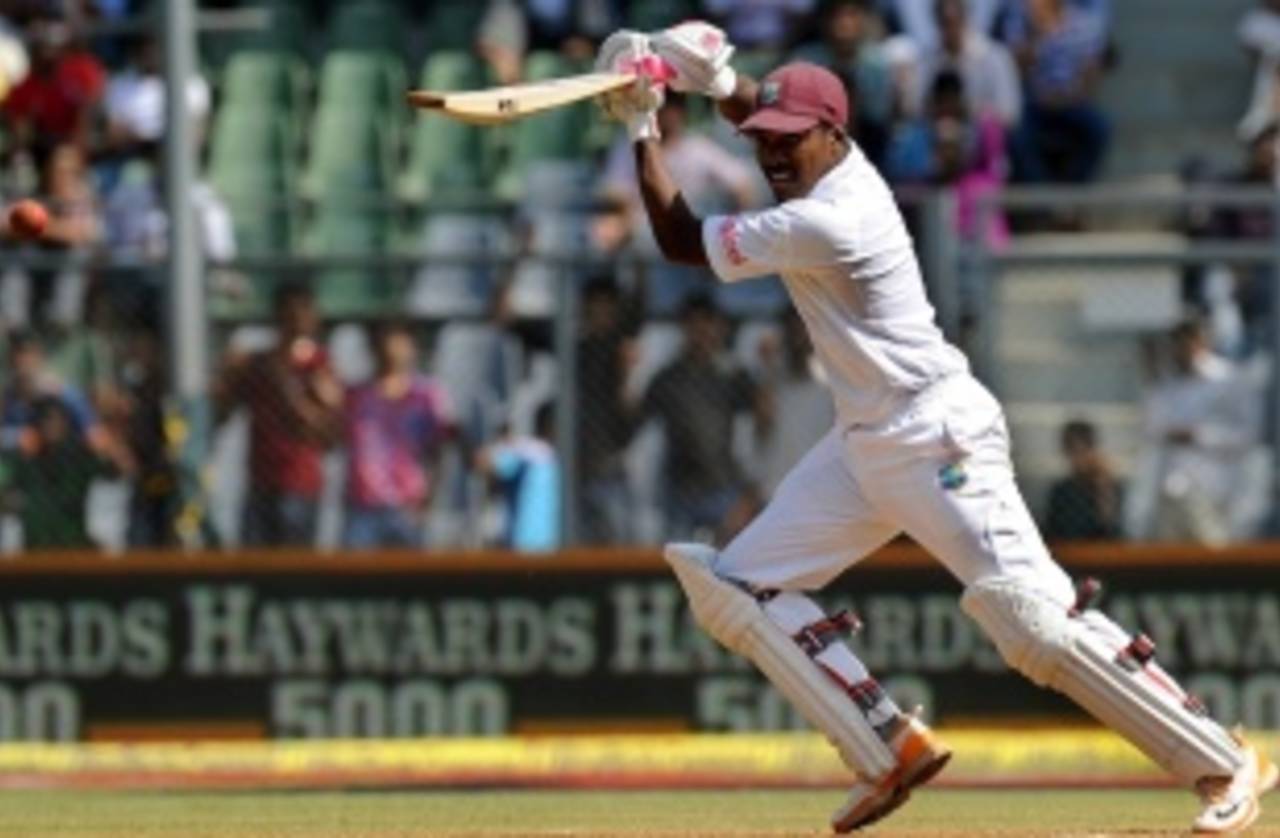
Darren Bravo: top scorer in the series with 404 runs at 67.33 • AFP
Trial by spin
When the series started, it lacked the sense of anticipation that was characteristic of India's tour of England. Considering the struggles that West Indies had been through in the last few years, the result seemed a foregone conclusion. A remarkable comeback by West Indies in the first Test when they bowled India out to gain a 95-run lead, however, infused sudden life into the contest, but was quickly snuffed out by the visitors' abject collapses in two consecutive innings. Despite fighting bravely in the second innings in Kolkata, West Indies seemed all set to be whitewashed by India, a team they had famously drubbed on many occasions in their heyday. But in a remarkable conclusion to an otherwise dull third Test, 17 wickets fell on a manic final day as India missed achieving the 243-run target by one run. Although the bowling lacked incisiveness, it was the West Indies' batting which often seemed to let them down. After getting into a dominant position in the first Test, they stunningly lost their first seven wickets for just 84 runs in their second innings. India again benefited from the brittleness of the West Indian batting line-up in Kolkata as the visitors folded for just 153 in their first innings in response to India's massive 631. Darren Bravo was the star of the show in the next two innings as his centuries helped West Indies post excellent totals. However, their technical frailties were exposed again in Mumbai on the final day as the India spinners scythed through the batting order. R Ashwin and Pragyan Ojha, although inexperienced, were able to trouble almost all West Indies' batsmen with their variations and together accounted for 42 of the 60 West Indian wickets in the series.
When the series started, it lacked the sense of anticipation that was characteristic of India's tour of England. Considering the struggles that West Indies had been through in the last few years, the result seemed a foregone conclusion. A remarkable comeback by West Indies in the first Test when they bowled India out to gain a 95-run lead, however, infused sudden life into the contest, but was quickly snuffed out by the visitors' abject collapses in two consecutive innings. Despite fighting bravely in the second innings in Kolkata, West Indies seemed all set to be whitewashed by India, a team they had famously drubbed on many occasions in their heyday. But in a remarkable conclusion to an otherwise dull third Test, 17 wickets fell on a manic final day as India missed achieving the 243-run target by one run. Although the bowling lacked incisiveness, it was the West Indies' batting which often seemed to let them down. After getting into a dominant position in the first Test, they stunningly lost their first seven wickets for just 84 runs in their second innings. India again benefited from the brittleness of the West Indian batting line-up in Kolkata as the visitors folded for just 153 in their first innings in response to India's massive 631. Darren Bravo was the star of the show in the next two innings as his centuries helped West Indies post excellent totals. However, their technical frailties were exposed again in Mumbai on the final day as the India spinners scythed through the batting order. R Ashwin and Pragyan Ojha, although inexperienced, were able to trouble almost all West Indies' batsmen with their variations and together accounted for 42 of the 60 West Indian wickets in the series.
In recent years, with the exception of Shivnarine Chanderpaul, no other West Indies batsman has consistently been able to bat with any kind of assurance against top-quality spin. The fall in standards of batting is far more evident when the stats of top-order West Indies batsmen against spinners are compared with those of Brian Lara and Chanderpaul. Lara, an outstanding player of spin, scored at nearly four runs per over and averaged an exceptional 80.07 across 65 innings. Chanderpaul's scoring-rate has been much lower than Lara's but he has a high average of 57.39 in 132 innings. The story is, however, very different for the rest of the West Indies batsmen. Although having played only a handful of matches, only Bravo and Kirk Edwards have demonstrated strong performances against spin. In the absence of Chris Gayle, who has done exceedingly well against spinners (average 106.66 and scoring-rate of 3.64), West Indies have hardly put up a fight when confronted with quality spin. In matches played since 2008, West Indies batsmen (other than Gayle) average just 24.05 against spinners and score at under three runs per over. Overall, in the last three years, West Indies have an average of 27.94 against spin. In sharp contrast, England and India have averages of 49.50 and 43.29 respectively.
| Batsman | Innings | Runs | Dismissals | Average | Scoring rate |
| Brian Lara * | 65 | 2242 | 28 | 80.07 | 3.90 |
| Shivnarine Chanderpaul | 132 | 2927 | 51 | 57.39 | 2.67 |
| Darren Bravo | 23 | 709 | 12 | 59.08 | 2.89 |
| Kirk Edwards | 11 | 370 | 7 | 52.85 | 2.75 |
| Other batsmen since 2008 ** | 225 | 3295 | 137 | 24.05 | 2.91 |
* Lara's stats from May 2001 till his retirement
**stats since 2008 for batsmen other than Bravo, Edwards, Gayle and Chanderpaul
**stats since 2008 for batsmen other than Bravo, Edwards, Gayle and Chanderpaul
West Indies improving away
Despite the 2-0 series defeat, West Indies have a lot of positives to take out of this performance. They bowled and fielded superbly in the first match in Delhi and made a match of it. Barring the collapse in the first innings in Kolkata, they showed a lot of character. In the third match, astute captaincy and responsible bowling ensured that they would not be whitewashed for the first time by India. The trend of performing better in away series has been startling. Since November 2009, West Indies have always managed to raise their performance in away series and pose a challenge for most teams. However, in home Tests, they have hardly been able to churn out a similar display. Against a strong Australia team, they fought gamely and had the better of the drawn Test in Adelaiden in 2009-10. In a rain-affected series in Sri Lanka in 2010-11, Chris Gayle's triple-century spurred them to dominate the first Test and earn a 0-0 scoreline in a country where they had been blanked 3-0 in 2001. The concern, however, will be their shoddy batting performances in home Tests. Against South Africa, India and Pakistan in home series, they have failed to average more than 30. On the positive side, their bowling in home Tests has been fairly encouraging. They average 34.10 in eight home Tests since November 2008 as compared to 41.47 in 11 away Tests. This is a clear indication that West Indies will have to raise their batting to a more consistent level if they are to stay competitive in matches against top Test teams.
Despite the 2-0 series defeat, West Indies have a lot of positives to take out of this performance. They bowled and fielded superbly in the first match in Delhi and made a match of it. Barring the collapse in the first innings in Kolkata, they showed a lot of character. In the third match, astute captaincy and responsible bowling ensured that they would not be whitewashed for the first time by India. The trend of performing better in away series has been startling. Since November 2009, West Indies have always managed to raise their performance in away series and pose a challenge for most teams. However, in home Tests, they have hardly been able to churn out a similar display. Against a strong Australia team, they fought gamely and had the better of the drawn Test in Adelaiden in 2009-10. In a rain-affected series in Sri Lanka in 2010-11, Chris Gayle's triple-century spurred them to dominate the first Test and earn a 0-0 scoreline in a country where they had been blanked 3-0 in 2001. The concern, however, will be their shoddy batting performances in home Tests. Against South Africa, India and Pakistan in home series, they have failed to average more than 30. On the positive side, their bowling in home Tests has been fairly encouraging. They average 34.10 in eight home Tests since November 2008 as compared to 41.47 in 11 away Tests. This is a clear indication that West Indies will have to raise their batting to a more consistent level if they are to stay competitive in matches against top Test teams.
| Opponent (home/away) | Matches | W/L | Batting Average | Bowling average | Avg diff |
| Australia (away) | 3 | 0/2 | 30.30 | 45.02 | -14.72 |
| South Africa (home) | 3 | 0/2 | 26.66 | 48.08 | -21.42 |
| Sri Lanka (away) | 3 | 0/0 | 39.24 | 44.29 | -5.05 |
| Pakistan (home) | 2 | 1/1 | 20.77 | 27.41 | -6.64 |
| India (home) | 3 | 0/1 | 23.73 | 28.75 | -5.02 |
| Bangladesh (away) | 2 | 1/0 | 40.07 | 30.56 | 9.51 |
| India (away) | 3 | 0/2 | 30.40 | 44.87 | -14.47 |
| Overall (home) | 8 | 1/4 | 23.92 | 34.10 | -10.18 |
| Overall (away) | 11 | 1/4 | 33.30 | 41.47 | -8.17 |
Except for the first innings in Kolkata, the India batsmen failed to live up to their high standards, despite coming up against an average bowling attack. Bad shot selection and lack of patience contributed to many wickets and it was only West Indies' inability to sustain pressure that let India off the hook in the first and third Test. Virender Sehwag and Gautam Gambhir failed to put on century stands, something they have regularly been able to do in the last few years. The West Indies openers were scratchy too averaging just 32.33 with only one century stand, in the third Test in Mumbai. India's inability to forge century stands for any of the top three wickets in a home series is shocking but a clear reflection of failure on the batsmen's part to apply themselves. Along with Chanderpaul, Bravo and Edwards were the only players who seemed to find their feet against the India spinners. This meant that West Indies matched and often bettered India when it came to the middle-order partnerships. The fourth-wicket stand was most productive for West Indies as it was responsible for three of the six century stands.
| Partnership wicket | India | West Indies |
| 1 | 58.40, 0/4 | 32.33, 1/0 |
| 2 | 58.20, 0/3 | 32.33, 0/1 |
| 3 | 45.40, 0/3 | 53.00, 1/1 |
| 4 | 57.60, 1/2 | 71.33, 3/0 |
| 5 | 32.40, 0/1 | 42.00, 1/0 |
| 6 | 21.00, 0/1 | 16.16, 0/1 |
Bravo the standout player
In a series characterised by West Indies' struggles against India's spinners, Bravo stood out with his superb batting. Not only did he showcase a batting style similar to Lara's, he also emulated the West Indies batting great by scoring two excellent centuries in spin-friendly conditions. He averaged over 67 against pace and spin and had a very high balls-per-dismissal figure against spinners (124.50). Other than Bravo and the experienced Chanderpaul, the rest of the batsmen had very little idea of how to approach the situation. Brathwaite showed a lot of patience in almost every innings he played but could never impose himself on the bowling. He had a scoring-rate of under two runs per over and was dismissed five times by the spinners. Marlon Samuels, who scored at over five runs per over off the fast bowlers was found wanting against spin. In scoring just 101 runs at 3.10, he was dismissed on five occasions.
In a series characterised by West Indies' struggles against India's spinners, Bravo stood out with his superb batting. Not only did he showcase a batting style similar to Lara's, he also emulated the West Indies batting great by scoring two excellent centuries in spin-friendly conditions. He averaged over 67 against pace and spin and had a very high balls-per-dismissal figure against spinners (124.50). Other than Bravo and the experienced Chanderpaul, the rest of the batsmen had very little idea of how to approach the situation. Brathwaite showed a lot of patience in almost every innings he played but could never impose himself on the bowling. He had a scoring-rate of under two runs per over and was dismissed five times by the spinners. Marlon Samuels, who scored at over five runs per over off the fast bowlers was found wanting against spin. In scoring just 101 runs at 3.10, he was dismissed on five occasions.
Sehwag, as usual, boasted an exceptional scoring-rate against both pace and spin. He, however, failed to get his customary big score, falling on almost every occasion to a rash stroke. Darren Sammy seemed to have the better of Sehwag, dismissing him three times while conceding just 61 runs. Rahul Dravid, who did fall to a couple of loose strokes, was hardly troubled consistently by a particular bowler while VVS Laxman, who anchored the Delhi chase, was not dismissed more than once by a particular bowler. Sachin Tendulkar, however, burdened by the approaching landmark of 100 international centuries, seemed less certain against spinners. He was dismissed three times scoring 89 runs and lost his wicket twice to Devendra Bishoo, who was quite impressive.
| Batsman | Pace | Spin | Most successful bowler (highest dismissals) |
| Virender Sehwag | 60.66/3, 5.57, 65.33 | 31.50/2, 7.13, 26.50 | Darren Sammy (20.33/3, 7.46, 16.33) |
| Rahul Dravid | 70.50/2, 2.76, 102.00 | 59.33/3, 3.43, 103.66 | Marlon Samuels (39.50/2, 4.01, 59.00) |
| VVS Laxman | 62.00/2, 3.97, 62.66 | 174.00/1, 3.36, 103.33 | Devendra Bishoo (78.00/1, 2.98, 157.00) |
| Sachin Tendulkar | 64.50/2, 3.92, 65.66 | 29.66/3, 2.67, 66.66 | Devendra Bishoo (32.00/2, 2.47, 77.50) |
| Darren Bravo | 67.50/2, 3.41, 79.00 | 67.25/4, 3.24, 124.50 | R Ashwin (58.50/2, 3.05, 76.66) |
| Kirk Edwards | 29.33/3, 2.98, 59.00 | 46.33/3, 2.71, 102.33 | Pragyan Ojha (18.33/3, 2.18, 50.33) |
| Kraigg Brathwaite | 59.00/1, 2.00, 177.00 | 27.00/5, 1.92, 84.20 | Pragyan Ojha (18.00/3, 1.50, 72.00) |
| Shivnarine Chanderpaul | 49.00/2, 3.76, 52.00 | 59.00/2, 3.57, 66.00 | R Ashwin (31.50/2, 5.17, 36.50) |
India spinners complement each other
In what was a remarkable debut series, Ashwin picked up 22 wickets and also scored a century in the third Test. He twice picked up five-wicket hauls and had most of the West Indies batsmen confounded with his variety. Ashwin was particularly effective against the left-handers averaging just 20.63 while picking up 11 wickets. Although he had a slightly higher average against right-handers, he was still very successful against them. Ojha, on the other hand, was much more at ease bowling to right-handers with his stock ball being the one turning away from them. He picked up 15 wickets at 18.26 against right-handers but struggled against left-handers averaging 35.20 with five dismissals.
In what was a remarkable debut series, Ashwin picked up 22 wickets and also scored a century in the third Test. He twice picked up five-wicket hauls and had most of the West Indies batsmen confounded with his variety. Ashwin was particularly effective against the left-handers averaging just 20.63 while picking up 11 wickets. Although he had a slightly higher average against right-handers, he was still very successful against them. Ojha, on the other hand, was much more at ease bowling to right-handers with his stock ball being the one turning away from them. He picked up 15 wickets at 18.26 against right-handers but struggled against left-handers averaging 35.20 with five dismissals.
West Indies, who were plagued by injuries as the series went on, struggled to rein in the scoring but did an excellent job with the limited resources they had. Sammy, who was often underestimated by India batsmen, was the leading wicket-taker and also proved to be quite economical. Ravi Rampaul bowled with a lot of heart and picked up eight wickets at 28.62. The rest of the bowling, however, was not sharp enough to cause any worries to a powerful India batting line-up.
| Bowler | Batsman type | Wickets | Average | Scoring rate |
| R Ashwin | right-hander | 11 | 25.18 | 2.85 |
| R Ashwin | left-hander | 11 | 20.63 | 3.10 |
| Pragyan Ojha | right-hander | 15 | 18.26 | 2.25 |
| Pragyan Ojha | left-hander | 5 | 35.20 | 3.15 |
Dhoni's struggles
MS Dhoni had a superb start as captain, going unbeaten in a series till the England tour where India were crushed 4-0. His batting form, however, went downhill from the Sri Lanka tour in 2010. In 21 matches played since, Dhoni's average has plummeted to 30.59 with just one century coming in the second Test in Kolkata against West Indies. Although his average as a captain (43.15) is better than his career average of 38.28, it is his recent form that is a major cause for concern ahead of the challenging tour of Australia. In Tests in 2011, Dhoni has scored just three half-centuries in away Tests, including two in hopeless causes in England. Considering how crucial Dhoni is to the batting line-up, India will be hoping he transfers his ODI form in the same period (average of 51.28 in 34 matches) to the Test arena.
MS Dhoni had a superb start as captain, going unbeaten in a series till the England tour where India were crushed 4-0. His batting form, however, went downhill from the Sri Lanka tour in 2010. In 21 matches played since, Dhoni's average has plummeted to 30.59 with just one century coming in the second Test in Kolkata against West Indies. Although his average as a captain (43.15) is better than his career average of 38.28, it is his recent form that is a major cause for concern ahead of the challenging tour of Australia. In Tests in 2011, Dhoni has scored just three half-centuries in away Tests, including two in hopeless causes in England. Considering how crucial Dhoni is to the batting line-up, India will be hoping he transfers his ODI form in the same period (average of 51.28 in 34 matches) to the Test arena.
| Period | Matches | Runs | Average | 100/50 |
| Overall (2005-2011) | 64 | 3407 | 38.28 | 5/23 |
| As captain (2008-2011) | 34 | 1985 | 43.15 | 4/14 |
| In 2011 | 11 | 482 | 28.35 | 1/3 |
| Last seven series (since July 2010) | 21 | 979 | 30.59 | 1/6 |