Venue record a boost for India
India, under pressure following the loss in Melbourne, will take confidence from their ability to bounce back in away series and their batting record in Sydney
Madhusudhan Ramakrishnan
Jan 1, 2012, 3:26 PM
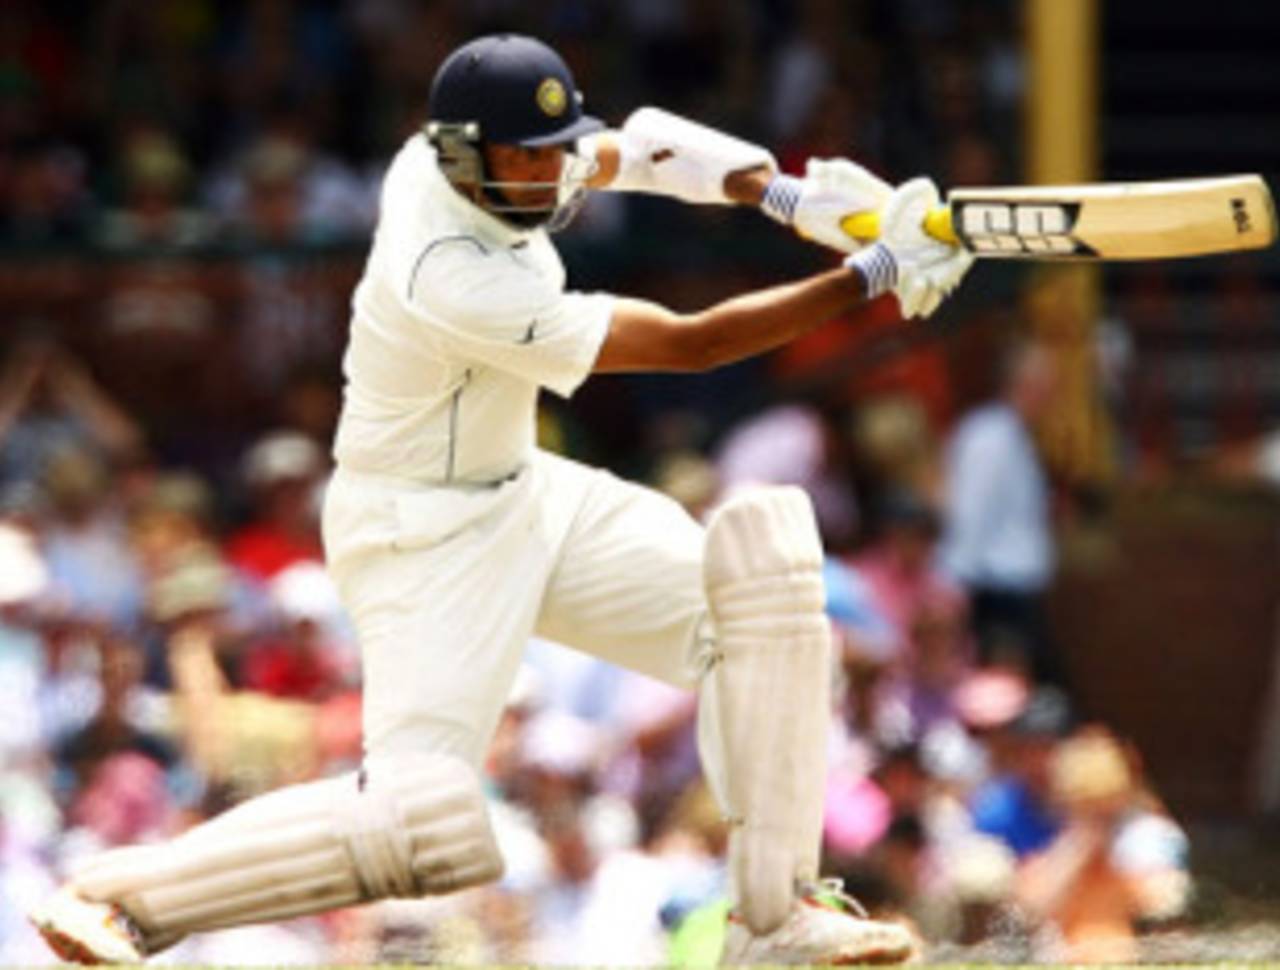
VVS Laxman has scored a century in each of the three matches he has played at the SCG • Getty Images
India's best chance to mount comeback
For the first time in their last five visits, India were in a position of strength for much of the Boxing Day Test but twin batting collapses and defensive fields let Australia back into the contest. The 122-run defeat leaves India with a mountain to climb ahead of the second Test in Sydney. The last time a visiting team went on to win a series in Australia despite a defeat in the Boxing Day Test was way back in 1992-93 when West Indies fought back to win the next two Tests in Adelaide and Perth to clinch the series 2-1.
For the first time in their last five visits, India were in a position of strength for much of the Boxing Day Test but twin batting collapses and defensive fields let Australia back into the contest. The 122-run defeat leaves India with a mountain to climb ahead of the second Test in Sydney. The last time a visiting team went on to win a series in Australia despite a defeat in the Boxing Day Test was way back in 1992-93 when West Indies fought back to win the next two Tests in Adelaide and Perth to clinch the series 2-1.
On each of their previous three away tours in Sri Lanka, South Africa and England, India have gone on to lose the first Test of the series. In both Sri Lanka and South Africa, India drew the series 1-1 but were unable to replicate this in England and went on to lose 4-0. It is not only India's ability to claw back in an away series after an early reversal but also their strong record in Sydney that will give them confidence ahead of the crucial contest.
India have been woeful in Tests at the MCG in each of their previous tours going down by heavy margins on all four occasions. Their record at the SCG is much more positive. In both 1991 and 2003, India had the better of the drawn matches. On the ill-fated 1999 tour, VVS Laxman's debut century was the only high point in an embarrassing innings defeat. On their last tour, however, India dominated an acrimonious Test before going down by 122 runs after losing three wickets in a single over in the final session.
Among all Australian venues, India's batting average is the highest (44.80) in Sydney followed by Adelaide. India, who have played only two Tests in Perth and Brisbane, have a negative average difference in both venues but their corresponding figures are far more encouraging in Adelaide (-3.80) and Sydney (-4.80).
| Venue | Matches | Wins | Losses | Draws | Bat avg | Bowl avg | Avg diff |
| Melbourne | 5 | 0 | 5 | 0 | 23.92 | 40.16 | -16.24 |
| Sydney | 4 | 0 | 2 | 2 | 44.00 | 48.80 | -4.80 |
| Adelaide | 4 | 1 | 2 | 1 | 34.30 | 38.10 | -3.80 |
| Brisbane | 2 | 0 | 1 | 1 | 27.40 | 43.69 | -16.29 |
| Perth | 2 | 1 | 1 | 0 | 25.92 | 35.13 | -9.21 |
Hosts struggle in recent Tests
In the last two years, Australia have failed to dominate Tests in Sydney like they did for most of the 2000s. Between 2000 and the end of the Ashes in 2007, Australia were hardly tested in Sydney Tests, winning eight out of ten with the only loss coming against England in a dead rubber in 2003.
In the last two years, Australia have failed to dominate Tests in Sydney like they did for most of the 2000s. Between 2000 and the end of the Ashes in 2007, Australia were hardly tested in Sydney Tests, winning eight out of ten with the only loss coming against England in a dead rubber in 2003.
Following the retirements of most top players at the end of the 2006-07 Ashes, Australia's dominance in home Tests has significantly reduced. They have won three and lost one of their last four Tests in Sydney. In 2010, they were in trouble for much of the game against Pakistan before Michael Hussey's chancy but invaluable 134 enabled them to seize the initiative. They were not quite that fortunate against a powerful England team in the Ashes Test in January and went down by an innings and 83 runs.
In the 1990s, Australia had a record of 3-2 in Tests in Sydney and this is reflected in a low average difference of just 2.11. In contrast, the corresponding figure went up to 13.91 in their heyday in the early 2000s but has since fallen again to just 1.50 in the period since 2007.
| Period | Matches | Wins | Losses | Draws | W/L ratio | Bat avg | Bowl avg | Avg diff |
| Overall | 99 | 54 | 28 | 17 | 1.92 | 31.88 | 28.44 | 3.44 |
| 1990-1999 | 10 | 3 | 2 | 5 | 1.50 | 32.44 | 30.33 | 2.11 |
| 2000-2006 (till end of Ashes 2006-07) | 10 | 8 | 1 | 1 | 8.00 | 46.82 | 32.91 | 13.91 |
| 2007 onwards | 4 | 3 | 1 | 0 | 3.00 | 37.11 | 35.60 | 1.51 |
Preferred venue for top batsmen
In the first Test in Melbourne, the much-vaunted Indian batting line-up did not quite live up the pre-series hype. Except for Sachin Tendulkar, no other batsman looked comfortable on a surface which consistently offered some help for the quick bowlers. Tendulkar, India's highest run-getter in Australia, has had an outstanding run in Tests in Sydney, scoring 664 runs in four Tests at an average of 221.33. In his previous two Tests at the venue, Tendulkar's unbeaten scores of 241 and 154 enabled India to compile huge totals on both occasions. Laxman, whose struggles at the MCG continued with twin failures, will be more than eager to bat in Sydney. He has scored centuries on each of his three visits to the ground and averages 96.20. In sharp contrast, his average in all other venues in Australia is a very modest 35.47. While both Tendulkar and Laxman have been far more successful in Sydney in comparison to the other grounds, Rahul Dravid has a fairly even record across venues.
In the first Test in Melbourne, the much-vaunted Indian batting line-up did not quite live up the pre-series hype. Except for Sachin Tendulkar, no other batsman looked comfortable on a surface which consistently offered some help for the quick bowlers. Tendulkar, India's highest run-getter in Australia, has had an outstanding run in Tests in Sydney, scoring 664 runs in four Tests at an average of 221.33. In his previous two Tests at the venue, Tendulkar's unbeaten scores of 241 and 154 enabled India to compile huge totals on both occasions. Laxman, whose struggles at the MCG continued with twin failures, will be more than eager to bat in Sydney. He has scored centuries on each of his three visits to the ground and averages 96.20. In sharp contrast, his average in all other venues in Australia is a very modest 35.47. While both Tendulkar and Laxman have been far more successful in Sydney in comparison to the other grounds, Rahul Dravid has a fairly even record across venues.
Ricky Ponting shook off a barren run and registered two vital half-centuries in the Boxing Day win. In the second innings, with Australia in strife at 27 for 4, Ponting and Michael Hussey added a vital 115 to drag the match back in Australia's favour. Ponting, who has scored 1346 runs at 64.09 in Sydney, has struggled of late at the venue scoring just 120 runs in his last six innings. Hussey, who also played himself back into form with 89 in the second innings, has a much better record in Sydney when compared to the other home venues. Michael Clarke, however, has a very poor record in Sydney (average 28.25) and will look to strike form in the second Test after an ordinary display in Melbourne.
| Batsman | Matches (SCG) | Runs/avg (SCG) | 100/50(SCG) | Matches (other grounds) | Runs/avg (other grounds) | 100/50 (other grounds) |
| Sachin Tendulkar | 4 | 664/221.33 | 3/1 | 13 | 963/38.52 | 3/5 |
| VVS Laxman | 3 | 481/96.20 | 3/0 | 9 | 603/35.47 | 1/3 |
| Rahul Dravid | 3 | 249/49.80 | 0/2 | 9 | 778/51.86 | 1/4 |
| Ricky Ponting | 15 | 1346/64.09 | 5/6 | 71 | 5778/55.55 | 16/31 |
| Michael Clarke | 7 | 339/28.25 | 1/0 | 31 | 2331/56.85 | 8/10 |
| Michael Hussey | 6 | 550/78.57 | 2/0 | 30 | 2513/55.84 | 8/13 |
Spinners' role vital
Over the years, Sydney has been a venue that has offered assistance to spinners. However, in the first and second innings, the pitches have generally tended to favour pace bowlers. Fast bowlers average 29.67 in the first innings while spinners average a much higher 41.83.
Over the years, Sydney has been a venue that has offered assistance to spinners. However, in the first and second innings, the pitches have generally tended to favour pace bowlers. Fast bowlers average 29.67 in the first innings while spinners average a much higher 41.83.
The runs-per-wicket figure in the first innings (33.20 for Australia and 36.06 for visiting teams) is lower than the corresponding figure in the second innings. As a consequence, both pace bowlers and spinners have considerably higher averages in the second innings. Visiting teams have struggled in the third and fourth innings averaging just 25.61 and 19.12 respectively. In both these innings, Australia have been far superior with averages of 37.04 and 132.00. In the third and fourth innings, the distribution of wickets between pace and spin is fairly even with spinners averaging 34.92 and 20.89.
| Innings number | Runs per wicket (Australia/visitors) | 100/50 | Pace (wickets/avg) | Spin (wickets/avg) |
| 1st innings | 33.20/36.06 | 6/9 | 52/29.67 | 24/41.83 |
| 2nd innings | 44.00/41.34 | 8/13 | 56/40.58 | 21/45.33 |
| 3rd innings | 37.04/25.61 | 3/11 | 36/31.72 | 27/34.92 |
| 4th innings | 132.00/19.12 | 1/4 | 21/31.95 | 19/20.89 |
Result-oriented venue
Sydney, which hosted its first Test in 1882, is on verge of becoming only the third venue after Lord's and Melbourne to host 100 Tests. A comparison of the four venues that have hosted 90-plus Tests is quite interesting. While the result percentages at Lord's and The Oval are 61.78 and 61.70, the numbers are far higher in the two Australian grounds. This is mostly due to the fact that almost every game played in Australia before the Second World War was a 'Timeless Test' (matches played to a result).
Sydney, which hosted its first Test in 1882, is on verge of becoming only the third venue after Lord's and Melbourne to host 100 Tests. A comparison of the four venues that have hosted 90-plus Tests is quite interesting. While the result percentages at Lord's and The Oval are 61.78 and 61.70, the numbers are far higher in the two Australian grounds. This is mostly due to the fact that almost every game played in Australia before the Second World War was a 'Timeless Test' (matches played to a result).
However, the trend has not changed even after 1970. The result percentages in the Melbourne and Sydney have continued to be higher than those in the two England grounds. The larger size of the grounds in Australia has also meant that the average number of centuries per match is also lower. While the average number of wickets per match at Lord's is 30.26, the figure is over 33 at The Oval and the two Australian venues.
| Ground | Matches | Results/draws | Result % | W/L ratio (home team) | Matches (since 1970) | Results/draws | Result % | 100s per match | wickets per match |
| Lord's | 123 | 76/47 | 61.78 | 1.74 | 67 | 40/27 | 59.70 | 1.77 | 30.26 |
| Melbourne | 104 | 89/15 | 85.57 | 1.96 | 48 | 39/9 | 81.25 | 1.63 | 33.80 |
| Sydney | 99 | 82/17 | 82.82 | 1.92 | 45 | 34/11 | 75.55 | 1.60 | 33.60 |
| The Oval | 94 | 58/36 | 61.70 | 2.05 | 41 | 24/17 | 58.53 | 1.67 | 33.13 |
Stats highlights from Tests played in Sydney
- Shane Warne, with 64 wickets at 28.12, is the highest wicket-taker in Tests at the SCG. Stuart MacGill is next, with 53 wickets at 24.47.
- Ponting holds the record for the most centuries scored at the SCG (5). Among visiting batsmen, Wally Hammond is on top with four centuries in five Tests.
- Four of the top five individual scores made in Sydney are by overseas batsmen. RE Foster is on top with 287 followed by Brian Lara, who made 277 in 1993.
- The closest result (in terms of runs) is the five-run win for South Africa in 1994 when they successfully defended a target of 117.
- The highest partnership at the SCG is 405 between Sid Barnes and Don Bradman in 1946. Laxman and Tendulkar are next, with their 353-run stand in 2004.