The InnSpell Value: A new bowler measure for Tests
An analysis of the best bowling performances in Tests
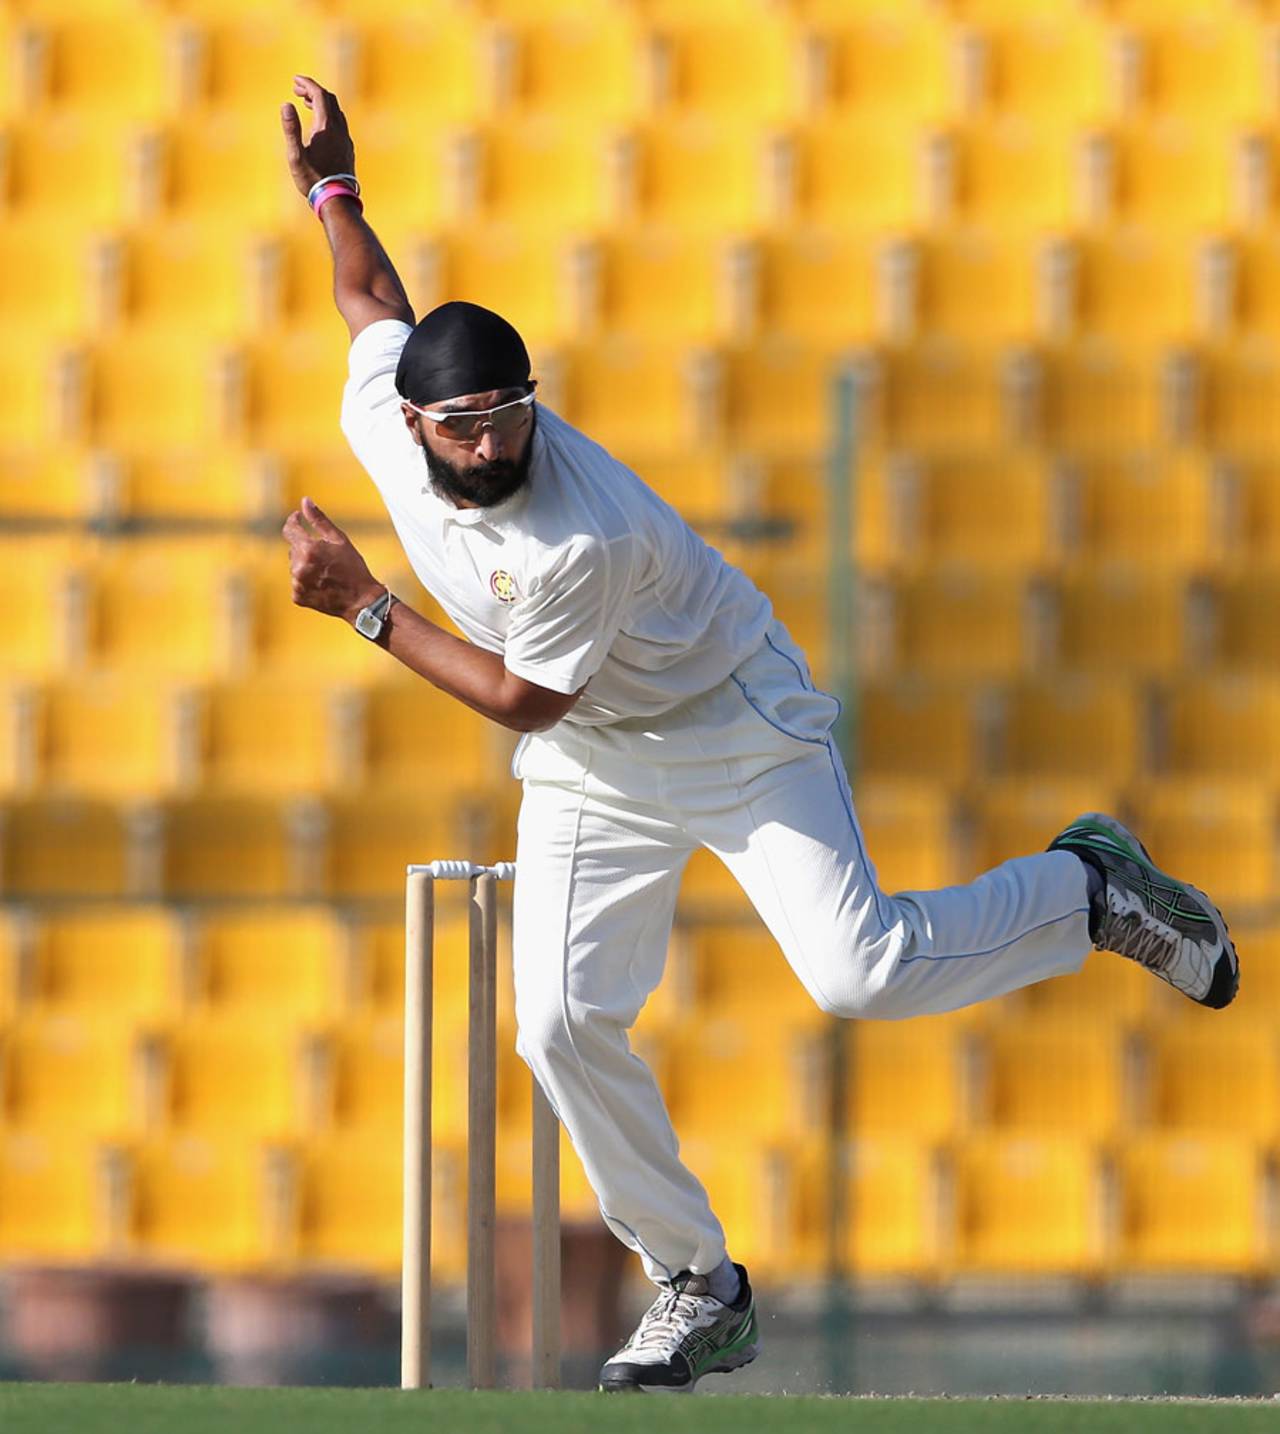
Monty Panesar's bowling effort at the Wankhede in 2012 is the second-best bowling performance based on ISV value, after Jim Laker's 19-wicket effort at the Old Trafford • Getty Images
The Tendulkar brace (on Tests and on ODIs) of articles, which were written during late-2013, led to the formation and development of HSI (High Score Index), a very effective measure for batsmen. There were many insightful and valuable comments from the readers and some of these are excellent suggestions which could shape HSI into an invaluable tool for measuring batsmen contributions. More of that in a later article.
A few readers wanted a similar measure for the bowlers. Excellent idea, and I had already planned for that. Meanwhile I had done a nostalgic, evocative article on forgotten Test innings, which was very well received. For this article as well, the readers wanted a bowler reprise. I said I would pen that.
Two promises. Two articles. Which one to take up first? I decided on the HSI-related article as I felt that was more important. I spent some time and worked out an excellent bowling measure. While reviewing the tables for that measure, lo and behold, I also found my second article. The top ten in the main table had six unknown performances. So one article, two great ideas taken care of.
Batsman-Runs: What is the first and foremost requirement of a Test batsman? In one phrase, score runs. Playing out time and facing many deliveries is normally secondary. To win matches, one has to score runs. Let us take two recent South Africa Tests. South Africa faced daunting tasks in both Tests: score well over 400 runs to win the Test, or bat out 140 overs.
Granted that the Indian and Australian bowling attacks they had to face were chalk and cheese. At Newlands they played defensively, playing out time, and lost. At Wanderers they batted in an attacking manner and almost won. The point is that when South Africa scored runs, India were pushed into a defensive stance and was almost made to pay for it. At no point were Australia put in that position. They attacked right through the nine hours and won.
If the batsmen score enough runs (even a single run more is sufficient) the team wins. So the batsmen measure was based on runs scored. Of course, readers could come up with instances in which a slow 50 would work better than a quick 100, or where playing out 100 balls is more important than scoring 100 runs. But these are exceptions and are more relevant to saving rather than winning Tests.
Bowler-Wickets: What is the bowler's role? Not to churn over after over. Not to bowl 50 overs at 1.5 RpO. It is to take wickets, pure and simple. That is the only way to win a Test. Let me exclude two Tests from all further discussions. The "arranged" single innings non-Test in Centurion, and the Test conceded by Pakistan at The Oval, when they were well ahead of England. To win a Test, a team has to capture 20 wickets: give or take a wicket or two due to declarations or player's inability to bat.
There can be only one method to measure a bowler's non-contextual contribution in a Test. Use the wickets he captured. This is a reflection of the adage that almost any day 10-0-50-5 is more valuable than 20-10-20-1 in Tests. And from the last Test at Newlands on the fifth day, Smith's 13-3-41-1 was far more valuable to Australia than Lyon's 22-17-10-0.
There are two principles I have worked on. All wickets are valuable. Some wickets are more valuable than others. To dismiss Michael Clarke at 10 is more valuable than dismissing him at 30, which is more valuable than dismissing him at 100, which is more valuable than letting Clarke go unbeaten.
ISV (InnSpell Value): So I developed a bowling index which is based only on the wickets captured. We work on a simple principle. Who did the bowler dismiss AND at what score did the bowler dismiss the batsman? At any time in his innings the batsman has in his tank enough fuel to score his average ahead. This was my basis for the extended batting average also. Whether the batsman is at 0 or 100, he is capable of adding his average to the score. He could add a lot more or a lot less. But this is a simple assumption which lets us get a handle on the situation.
The calculations are minimal. Each wicket has a fixed component, which is the dismissed batsman's appropriate career-to-date home/away/all batting average. There is a variable component, which is the difference between the appropriate career-to-date home/away/all batting average and the batsman score, subject to a minimum value of zero. At a pinch readers can substitute the career-to-date average with the career average since no online information portal provides career-to-date averages, that too separated home and away. However, then it must be understood that the ISV figures for a bowling performance will keep on varying as the dismissed batsman's career moves on. The career-to-date home/away method brings into focus the extraordinary batting strength of teams like Pakistan at home during the mid-1980s.
When Virender Sehwag was dismissed for 293 by Muttiah Muralitharan, the latter gets credit for 56.18, which was Sehwag's career-to-date Home (CTH) average at that time. This is because Sehwag was eminently capable of adding 56 runs to his score. Murali gets nothing on the variable front. In the same match when Mahela Jayawardene was dismissed for 12 by Zaheer Khan, Zaheer gets 72.16 points: Jayawardene's career-to-date Away (CTA) average of 44.08 (he could very well have added 44 to his score) plus 28.08 being the runs gained by dismissing Jayawardene early.
The highest credit for a dismissal is given to Eric Hollies for his dismissal of Don Bradman for 0 at The Oval during 1948. Bradman's CTA average at this time was 102.85. He got 102.85 for dismissing Bradman and 102.85 for dismissing Bradman at 0, a well-deserved total of 205.70. This huge credit went some way in getting Hollies 401 ISV points for his 5 for 131.
Readers may raise a very pertinent query. Why credit the bowler with the batsman average when they dismiss him past his average? The fact is that ANY dismissal has to have a certain value. Let us say Bradman scored 304, 244 and 105 in three consecutive innings. There is no way I can say that the third dismissal should not get any points since Bradman has already gone past his average. By dismissing Bradman at 105, the bowler has served his team quite well since he probably prevented Bradman scoring another double-century. The same idea will apply to other batsmen, at lower levels. Look at a Ricky Ponting sequence of 50, 242 and 257. Or the Brian Lara sequence of 400, 53 and 120. Or the Tendulkar sequence of 83, 143 and 139. Aren't those dismissals at 50, 53 and 83 worth at least the batsman averages? These cannot be pegged at zero just because the average was breached. Most certainly a bigger score was prevented from being scored.
Dimension: It should be remembered that, with run values distributed equally in numerator and denominator, the HSI is a dimension-less entity. However the ISV is a run-value since two run-values are added. Let me add that I have referred to ISV points in the articles rather than ISV runs to avoid confusion.
I have looked at methods of converting this into a dimension-less value. The only way is to determine the team ISV and get a ratio. But that immediately brings with it its own set of problems. No problems with high number of wicket-captures in an innings. At a pinch we could even give Suraj Randiv a 1.00 for capturing all five wickets out of India's 258 for 5 at the P Sara Oval, Colombo. However, if we do that in Sri Lanka's innings of 137 for 1, with the sole wicket being captured by Saeed Ajmal, he gets 1.00, which seems totally wrong. So we have to exclude innings in which less than a certain number of wickets were captured and so on. It seems to me a good idea to give that a miss now and leave it to the readers to come out with their own suggestions.
So it can be seen that the current work has no exclusions whatsoever. Every single relevant "innspell" is included. More on that later. By the by, what is an "innspell"? Frequent visitors to my blog will already be aware of this. For others, let me explain. This is a term I coined a few years back to define the complete bowling performance in an innings. A spell normally denotes an unbroken continuous bowling effort. When Ajmal bowls 56 overs, this could easily have been 3/4 spells. How do we refer to the complete bowling effort? "Bowling analysis" is too prosaic. Hence the term "innspell", a very descriptive term.
| SNo | ISV | Test # | Year | Inns | TeamScore | Bowler | For | Result | Vs | Bowling Innspell |
|---|---|---|---|---|---|---|---|---|---|---|
| 1 | 524.6 | 1027 | 1985 | 2 | 259/10 | JR Ratnayeke | Sri Lanka | Lost | Pak | 8 for 83 |
| 2 | 492.4 | 1028 | 1985 | 2 | 295/10 | ALF de Mel | Sri Lanka | Lost | Pak | 6 for 109 |
| 3 | 490.4 | 1804 | 2006 | 4 | 190/10 | M Muralitharan | Sri Lanka | Won | Eng | 8 for 70 |
| 4 | 488.1 | 428 | 1956 | 3 | 205/10 | JC Laker | England | Won | Aus | 10 for 53 |
| 5 | 469.7 | 1278 | 1994 | 4 | 114/10 | KCG Benjamin | West Indies | Won | Ind | 5 for 65 |
| 6 | 468.3 | 947 | 1983 | 1 | 323/10 | Kapil Dev | India | Draw | Pak | 8 for 85 |
| 7 | 459.5 | 738 | 1974 | 2 | 305/10 | AW Greig | England | Won | Win | 8 for 86 |
| 8 | 458.6 | 283 | 1947 | 2 | 253/10 | DVP Wright | England | Lost | Aus | 7 for 105 |
| 9 | 457.0 | 1000 | 1984 | 2 | 230/10 | SL Boock | New Zealand | Lost | Pak | 7 for 87 |
| 10 | 455.0 | 1443 | 1999 | 4 | 207/10 | A Kumble | India | Won | Pak | 10 for 74 |
| 11 | 452.7 | 599 | 1966 | 1 | 488/10 | NJN Hawke | Australia | Lost | Eng | 7 for 105 |
| 12 | 452.0 | 428 | 1956 | 2 | 84/10 | JC Laker | England | Won | Aus | 9 for 37 |
| 13 | 450.4 | 1734 | 2005 | 4 | 247/10 | MJ Hoggard | England | Won | Saf | 7 for 61 |
| 14 | 450.0 | 754 | 1975 | 1 | 304/10 | DL Underwood | England | Lost | Aus | 7 for 113 |
| 15 | 444.9 | 2062 | 2012 | 3 | 142/10 | MS Panesar | England | Won | Ind | 6 for 81 |
| 16 | 443.3 | 863 | 1979 | 2 | 126/10 | Sikander Bakht | Pakistan | Draw | Ind | 8 for 69 |
| 17 | 441.9 | 1756 | 2005 | 2 | 155/10 | GD McGrath | Australia | Won | Eng | 5 for 53 |
| 18 | 434.0 | 386 | 1954 | 1 | 139/10 | TE Bailey | England | Won | Win | 7 for 34 |
| 19 | 432.8 | 1153 | 1990 | 1 | 102/10 | C Pringle | New Zealand | Lost | Pak | 7 for 52 |
| 20 | 432.6 | 1266 | 1994 | 3 | 175/10 | DE Malcolm | England | Won | Saf | 9 for 57 |
| 21 | 431.5 | 1857 | 2008 | 1 | 463/10 | RP Singh | India | Lost | Aus | 4 for 124 |
| 22 | 430.0 | 1714 | 2004 | 1 | 235/10 | A Kumble | India | Draw | Aus | 7 for 48 |
| 23 | 428.7 | 234 | 1934 | 3 | 118/10 | H Verity | England | Won | Aus | 8 for 43 |
| 24 | 425.7 | 2093 | 2013 | 3 | 330/10 | RJ Harris | Australia | Lost | Eng | 7 for 117 |
| 25 | 425.3 | 1680 | 2004 | 2 | 474/10 | A Kumble | India | Draw | Aus | 8 for 141 |
| 26 | 424.6 | 1971 | 2010 | 1 | 446/10 | Mohammad Amir | Pakistan | Lost | Eng | 6 for 84 |
| 27 | 423.0 | 990 | 1984 | 2 | 245/10 | IT Botham | England | Lost | Win | 8 for 103 |
| 28 | 418.1 | 1825 | 2006 | 4 | 179/10 | M Ntini | South Africa | Won | Ind | 5 for 48 |
| 29 | 417.2 | 1615 | 2002 | 3 | 127/10 | Shoaib Akhtar | Pakistan | Lost | Aus | 5 for 21 |
| 30 | 416.7 | 1777 | 2005 | 1 | 258/10 | M Ntini | South Africa | Draw | Aus | 5 for 64 |
What do we have here? Could anyone have imagined that in a table of top bowling performances, on a new logical measure, the top ten would have bowlers such as Ravi Ratnayeke, Ashantha de Mel, Kenny Benjamin, Tony Greig, Doug Wright and Stephen Boock. Anil Kumble and Jim Laker are here because they captured ten wickets and Murali and Kapil Dev because they captured nine. And not one of these "lesser" (only in a "not-so-famous" sense) bowlers has even captured nine wickets: Benjamin, only five. So it looks like I have my "forgotten" performances also. Now I am quite convinced that this is indeed a measure that transcends numbers and reflects very strongly the quality of bowling.
What did Ratnayeke do to top a table of 26,262 relevant bowling performances spread over 137 years? Simply, he met the Pakistani juggernaut at their batting peak, away from Sri Lanka, and ripped the strong batting apart. This Pakistan team is the third-strongest batting combination ever: only their own team couple of years back and West Indies during 1958 are above them. Ratnayeke captured the wickets of Qasim Umar for 1(CTH avge:37.9), Javed Miandad for 40(81.8), Zaheer Abbas for 4(58.2), Salim Malik for 22(53.1), Imran Khan for 6(39.7), Saleem Yousuf for 23(20.0), Abdul Qadir for 10(14.9) and Wasim Akram for 4(4.0). Look at the high averages and you will understand the value of these wickets. It was indeed very tough for the visiting bowlers during the 1980s. So deservedly, Ratnayeke stands at the top.
De Mel almost did a reprise in the next match. He dismissed the top six Pakistani batsmen for 16, 13, 8, 63, 5 and 52. This time Mudassar Nazar, with a CTA-avge of 65.3, and Mohsin Khan with 48.3, were in the dismissed group. Needless to say, both were in a losing cause.
Murali captured eight England wickets, away at Trent Bridge and Laker captured all ten Australian wickets at Old Trafford. But look at Benjamin's effort. Only five wickets, but what a collection! Benjamin dismissed Navjot Sidhu for 0 (48.7), Sachin Tendulkar for 10 (72.9), Mohammad Azharuddin for 5 (59.0), Vinod Kambli for 0 (50.0) and Anil Kumble for 1 (17.7). Kambli's CTH average was higher but lowered since he had played fewer than 15 innings at home. West Indies won this Test comfortably. I would venture to say that this is probably amongst the best five-wicket hauls in Test history.
When we go into the 11-20 entries, we see Neil Hawke, Monty Panesar, Sikander Bakht, Trevor Bailey, Chris Pringle and Devon Malcolm. That means 12 relatively less-known bowlers occupy the top 20. More vindication for the efficacy of this measure. It is heart-warming to see Panesar's truly outstanding match-winning Mumbai spell in the top 20.
By the by, where are Bob Willis' 8 for 43, Hugh Tayfield's 9 for 113 and de Villiers' 6 for 43. Tayfield is in the 41st place, Willis is in 84th place and de Villiers is in 197th position. But let us not forget that Fanie de Villiers had three late-order batsmen among his six wicket spell. Allan Donald captured three top-order wickets.
| SNo | ISV for match | Test # | Year | For | Result | Vs | Bowler | Innspell-1 | ISV-1 | Innspell-2 | ISV-2 |
|---|---|---|---|---|---|---|---|---|---|---|---|
| 1 | 940.1 | 428 | 1956 | England | Won | Aus | JC Laker | 9/ 37 | 452.0 | 10/ 53 | 488.1 |
| 2 | 800.4 | 2062 | 2012 | England | Won | Ind | MS Panesar | 5/129 | 355.5 | 6/ 81 | 444.9 |
| 3 | 788.2 | 738 | 1974 | England | Won | Win | AW Greig | 8/ 86 | 459.5 | 5/ 70 | 328.7 |
| 4 | 763.4 | 1734 | 2005 | England | Won | Saf | MJ Hoggard | 5/144 | 313.0 | 7/ 61 | 450.4 |
| 5 | 718.8 | 1680 | 2004 | India | Draw | Aus | A Kumble | 8/141 | 425.3 | 4/138 | 293.5 |
| 6 | 713.4 | 1442 | 1999 | Pakistan | Won | Ind | Saqlain Mushtaq | 5/ 94 | 374.9 | 5/ 93 | 338.5 |
| 7 | 703.5 | 79 | 1904 | England | Won | Aus | W Rhodes | 7/ 56 | 341.3 | 8/ 68 | 362.2 |
| 8 | 702.4 | 234 | 1934 | England | Won | Aus | H Verity | 7/ 61 | 273.7 | 8/ 43 | 428.7 |
| 9 | 698.1 | 471 | 1959 | Pakistan | Won | Win | Fazal Mahmood | 6/ 34 | 342.4 | 6/ 66 | 355.7 |
| 10 | 698.0 | 1882 | 2008 | Sri Lanka | Won | Ind | M Muralitharan | 5/ 84 | 293.2 | 6/ 26 | 404.8 |
| 11 | 696.5 | 1796 | 2006 | Pakistan | Won | Slk | Mohammad Asif | 6/ 44 | 297.3 | 5/ 27 | 399.2 |
| 12 | 678.7 | 1089 | 1988 | India | Won | Win | ND Hirwani | 8/ 61 | 312.1 | 8/ 75 | 366.6 |
| 13 | 677.0 | 430 | 1956 | Pakistan | Won | Aus | Fazal Mahmood | 6/ 34 | 334.3 | 7/ 80 | 342.7 |
| 14 | 672.7 | 792 | 1977 | Pakistan | Won | Aus | Imran Khan | 6/102 | 403.1 | 6/ 63 | 269.6 |
| 15 | 668.8 | 1763 | 2005 | Australia | Draw | Eng | SK Warne | 6/122 | 385.4 | 6/124 | 283.4 |
| 16 | 656.9 | 2119 | 2014 | Australia | Won | Saf | MG Johnson | 7/ 68 | 383.5 | 5/ 59 | 273.4 |
| 17 | 653.4 | 1153 | 1990 | New Zealand | Lost | Pak | C Pringle | 7/ 52 | 432.8 | 4/100 | 220.6 |
| 18 | 651.8 | 1689 | 2004 | New Zealand | Won | Saf | CS Martin | 6/ 76 | 294.5 | 5/104 | 357.3 |
| 19 | 650.5 | 754 | 1975 | England | Lost | Aus | DL Underwood | 7/113 | 450.0 | 4/102 | 200.5 |
| 20 | 648.5 | 1443 | 1999 | India | Won | Pak | A Kumble | 4/ 75 | 193.5 | 10/ 74 | 455.0 |
| 21 | 648.3 | 1714 | 2004 | India | Draw | Aus | A Kumble | 7/ 48 | 430.0 | 6/133 | 218.3 |
| 22 | 645.9 | 699 | 1972 | Australia | Won | Eng | RAL Massie | 8/ 84 | 272.5 | 8/ 53 | 373.4 |
| 23 | 644.6 | 874 | 1980 | England | Won | Ind | IT Botham | 6/ 58 | 243.9 | 7/ 48 | 400.7 |
| 24 | 642.2 | 2073 | 2013 | Pakistan | Lost | Saf | Saeed Ajmal | 6/ 96 | 406.7 | 4/ 51 | 235.5 |
| 25 | 640.9 | 390 | 1954 | Pakistan | Won | Eng | Fazal Mahmood | 6/ 53 | 309.6 | 6/ 46 | 331.3 |
| 26 | 639.1 | 238 | 1935 | West Indies | Lost | Eng | EA Martindale | 3/ 39 | 236.2 | 5/ 22 | 402.9 |
| 27 | 634.7 | 1535 | 2001 | India | Won | Aus | Harbhajan Singh | 7/123 | 348.5 | 6/ 73 | 286.2 |
| 28 | 631.0 | 743 | 1974 | England | Draw | Pak | DL Underwood | 5/ 20 | 297.4 | 8/ 51 | 333.6 |
| 29 | 622.1 | 876 | 1980 | Australia | Lost | Pak | RJ Bright | 7/ 87 | 288.8 | 3/ 24 | 333.3 |
| 30 | 620.7 | 1636 | 2003 | England | Won | Aus | AR Caddick | 3/121 | 257.8 | 7/ 94 | 362.9 |
These are the top bowling performances, based on ISV points, in a Test match. I have not set any minimum for either innings.
It is not an exercise in "DNA analysis" to guess at who would lead the table. Laker captured 19 wickets in the match, leaving one wicket for Lock. So with two way-out performances, Laker's total for the Test is a whopping 940 points, with both performances exceeding 450 points.
The second performance is a bolt from the blue and very few would have anticipated this. Panesar's Mumbai performance against India is the second best. It gathers 800 points with both performances exceeding 350. Look at his scalps. Tendulkar for 8 and 8 (54.4), Sehwag for 30 and 9 (57.0), MS Dhoni for 29 and 6 (43.2) and R Ashwin in both innings.
The third best is Greig's 12-wicket performance against West Indies during 1974. This followed by Matthew Hoggard's match-winning brace against South Africa and Kumble's 12-wicket haul against Australia. Note that this is placed higher than the 14-wicket capture in Delhi. Saqlain Mushtaq's twin five-wicket hauls in Chennai is the only instance of a player in the top 20 with just ten wickets. Tendulkar for 0 and 136, Azharuddin for 11 and 7 and Rahul Dravid for 53 are the notable dismissals.
Narendra Hirwani and Bob Massie are comfortably placed in the top-30 table. A brief note on the pre-WW1 performances - Many of these 8-9-15-16-17 wicket performances do not find places in either table because of the considerably low batting averages.
| SNo | Bowler | Type | Country | Tests | Wickets | Avge | High ISV | Relevant Spells | Avge ISV |
|---|---|---|---|---|---|---|---|---|---|
| 1 | SF Barnes | RFM | Eng | 27 | 189 | 16.43 | 365.5 | 48 | 137.4 |
| 2 | M Muralitharan | rob | Slk | 133 | 800 | 22.73 | 490.4 | 227 | 127.8 |
| 3 | Saeed Ajmal | rob | Pak | 33 | 169 | 27.47 | 406.7 | 63 | 124.4 |
| 4 | RJ Hadlee | RF | Nzl | 86 | 431 | 22.30 | 381.3 | 138 | 124.1 |
| 5 | Fazal Mahmood | RFM | Pak | 34 | 139 | 24.71 | 355.7 | 47 | 122.3 |
| 6 | CV Grimmett | rlb | Aus | 37 | 216 | 24.22 | 374.2 | 66 | 120.3 |
| 7 | Imran Khan | RF | Pak | 88 | 362 | 22.81 | 411.2 | 128 | 119.6 |
| 8 | DW Steyn | RF | Saf | 72 | 362 | 23.02 | 355.2 | 131 | 119.5 |
| 9 | WJ O'Reilly | rlb | Aus | 27 | 144 | 22.60 | 344.8 | 48 | 118.6 |
| 10 | DK Lillee | RF | Aus | 70 | 355 | 23.92 | 293.0 | 124 | 118.5 |
| 11 | VD Philander | RFM | Saf | 23 | 112 | 20.12 | 331.6 | 43 | 117.7 |
| 12 | GF Lawson | RF | Aus | 46 | 180 | 30.56 | 383.0 | 72 | 115.8 |
| 13 | RJ Harris | RF | Aus | 24 | 103 | 22.56 | 425.7 | 45 | 112.8 |
| 14 | HMRKB Herath | lsp | Slk | 51 | 217 | 30.02 | 317.2 | 80 | 112.0 |
| 15 | BA Reid | LFM | Aus | 27 | 113 | 24.64 | 318.0 | 40 | 111.8 |
| 16 | MD Marshall | RF | Win | 81 | 376 | 20.95 | 339.6 | 147 | 111.0 |
| 17 | CEH Croft | RF | Win | 27 | 125 | 23.30 | 383.9 | 51 | 109.5 |
| 18 | AA Donald | RF | Saf | 72 | 330 | 22.25 | 333.6 | 125 | 108.7 |
| 19 | AR Caddick | RFM | Eng | 62 | 234 | 29.91 | 362.9 | 103 | 107.8 |
| 20 | GD McGrath | RFM | Aus | 124 | 563 | 21.64 | 441.9 | 235 | 107.7 |
| 21 | MG Johnson | LF | Aus | 59 | 264 | 27.42 | 383.5 | 110 | 107.5 |
| 22 | AV Bedser | RM | Eng | 51 | 236 | 24.90 | 284.5 | 88 | 107.1 |
| 23 | Shoaib Akhtar | RF | Pak | 46 | 178 | 25.69 | 417.2 | 76 | 107.1 |
| 24 | M Dillon | RFM | Win | 38 | 131 | 33.63 | 272.0 | 56 | 107.0 |
| 25 | GP Swann | rob | Eng | 60 | 255 | 29.97 | 396.9 | 100 | 106.1 |
| 26 | SK Warne | rlb | Aus | 145 | 708 | 25.42 | 385.4 | 255 | 105.9 |
| 27 | GD McKenzie | RF | Aus | 60 | 246 | 29.79 | 353.0 | 105 | 105.6 |
| 28 | CJ McDermott | RF | Aus | 71 | 291 | 28.63 | 361.5 | 116 | 105.2 |
| 29 | A Kumble | rlb | Ind | 132 | 619 | 29.65 | 455.0 | 228 | 104.8 |
| 30 | ARC Fraser | RFM | Eng | 46 | 177 | 27.32 | 379.6 | 74 | 104.8 |
This is a career-level analysis as I had done for HSI. The important point to be understood is that I have done this on the basis of a "relevant spell" rather on wickets. The wickets basis is grossly unfair to the leading bowlers, who, by the very fact that they are the best bowlers, tend to bowl in the later stages and capture a number of late-order wickets. This lowers their ISV average a lot. However, these things tend to even out during the course of an innspell. Hence I have decided to do this averaging based on number of relevant innspells bowled.
Relevant spell: What is a relevant bowling spell? Again very simple. Any innspell that is either ten overs long or in which a wicket has been captured is a relevant spell. The first condition basically says that normally any bowler worth his salt should be able to pick up a wicket in ten overs. The second condition is to take care of situations such as Ernie Toshack's 2.3-1-2-5, Bob Appleyard's 6.0-3-7-4 and Richie Benaud's 3.4-3-0-3. The cut-off is 40 innspells. This represents an average career of 25 Tests and is the minimum needed to get a valid average.
This table is a perfect exposition on who have been the greatest Test bowlers of all time. Sydney Barnes, in 48 relevant spells, has an outstanding ISV average of 137.4. Look at the significance of this value. The 137.4 represents dismissal of three good-quality batsmen at reasonably low scores, or four batsmen. Let us not forget that during Barnes' career the batting averages were still at not-too-high levels.
Muralit is second, some distance behind: average ISV of 127.8 points. But over 227 relevant spells. That number is mind-boggling. Such consistency over 14 years. Ajmal is in third position with 124.4 points, albeit in 63 attempts. In fourth place is the magnificent Richard Hadlee with 124.1 The fifth position is the first surprise. Fazal Mahmood, the master Pakistan seamer, has averaged 122.3 over 47 attempts. Incidentally, Mohammad Aamir would have been in the top position but he fell short of the cut-off. I am not too unhappy at this. I would rather talk of the greatness of Imran, Waqar, Wasim, Ajmal or Saqlain.
Where is Shane Warne? In 26th position. Glenn McGrath: 20th. Malcolm Marshall: 16th. Imran: 7th. Quite reasonable positions. But I hope the readers do not forget that this is not a bowler ratings table. But a table of bowlers using a single measure: the ISV.
What are the possible improvements to ISV? Let me speculate.
1. Look at GM (Geometric Mean). The lowest innspell ISV is 0 when no wicket is captured and the highest, as we have already seen, is 524. But for many top bowlers the highest ISV is around 400 or so. This is almost in the range of Test batsmen scores. So it looks like there is no need to use GM for this averaging. AM (Arithmetic Mean) is sufficient. I await reader comments.
2. Use Recent Form value (RF) as an add-on factor. This is an excellent idea and I have the RF information with me. But this will make the process more complicated and, in that manner, make this more difficult to easily determine the ISV figure. However, let me say that to a certain extent this has been taken care of since my CTX average figures include the current match being played.
3. Determine a dimension-less ISV(I) to do a career-level averaging. This value for any innspell will be equal to or less than 1.0, if the method I had recommended is adopted.
4. Infusion of the PQI (Pitch Quality Index) into the calculations. On the surface this makes sense. But this would make the whole process still more complicated. Would defeat the essence of simplicity.
This time I have held back the additional tables such as win/loss/draw, home/away, inns etc. since I thought it would be better to do those after I work out the final shape of the ISV once the reader comments are in.
To download/view the file containing all qualifying entries of the three tables, please CLICK HERE. My take is that many of the questions can be answered if you download this file, and view the contents.
To download/view the huge Excel file (size-3 Mb) containing details of the 9800+ innings with ISV values 100.0 and above, please CLICK HERE. Instead of asking me obvious questions for which the answers are already there in the tables, you could download the file and view the Excel sheet.
What is with Sri Lanka bowlers? There have been only four team totals below 40 in limited-over matches and Sri Lanka have been the bowling team in all these matches: against Zimbabwe (twice), Canada and Netherlands. And Sri Lanka have won each of these four matches by nine wickets.
Anantha Narayanan has written for ESPNcricinfo and CastrolCricket and worked with a number of companies on their cricket performance ratings-related systems