Bowlers on top
Stats highlights from the first 12 days of IPL 2012
S Rajesh and Madhusudhan Ramakrishnan
16-Apr-2012
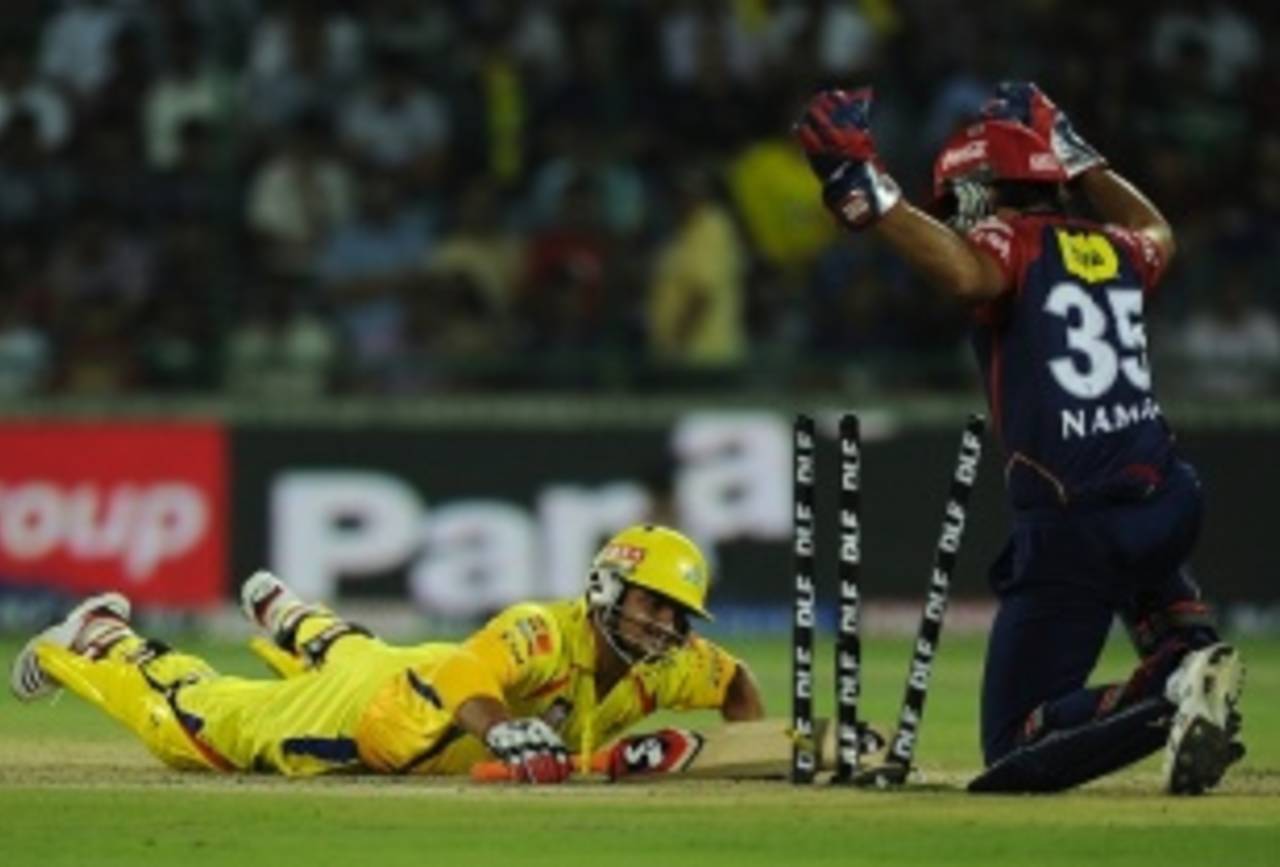
Suresh Raina is one of several top-order batsmen from Chennai Super Kings who hasn't made a significant contribution yet • AFP
One aspect that has stood out in IPL 2012 so far has been the extent to which bowlers have dominated. Of the 18 matches so far, 17 have been 20-over games, and in seven of those matches the team batting first has finished with a score of less than 140. Only once has the team batting first topped 200 (and ironically, Royal Challengers Bangalore couldn't defend that total, against Chennai Super Kings).
The table below compares the stats in the first 12 days of each of the five IPL seasons so far, and it's clear from the numbers below that the batsmen haven't been having it all their way. The overall run-rate so far this year is 7.59, which is exactly what the rate was after 12 days of IPL 2009, when the tournament was played in more bowler-friendly conditions in South Africa. Among all the editions played in India, the run-rate so far is clearly the lowest this season: in 2008 and 2010, the rates were more than eight per over, while it 2011 it was 7.98 after 12 days of comeptition. Even the current rate this year is thanks to the last four days, when Royal Challengers and Super Kings both scored more than 200, and Rajasthan Royals fell only five short of the mark.
In terms of averages, this year's 21.41 falls marginally below the 2009 mark of 21.83 at the same stage of the tournament, and well below the averages achieved in the three previous editions which were held in India. Last year, the average was 30.23, with 29 fifties and two hundreds in 19 games; this year, after 18, the fifties and hundreds are about half that number. The 20-over format is meant to be a run-fest with batsmen calling the shots, but this year the bowlers, with their clever variations in pace and length, have made life pretty difficult for batsmen. The pitches in some of the venues - slow and low in Kolkata, green and seamer-friendly in Mohali - have further added to the batting woes.
| Season | Matches | Average | RPO | 100s/50s | 4s/6s | Boundary % | Boundary runs/match |
| 2008 | 16 | 27.20 | 8.53 | 4/20 | 495/196 | 61.37 | 197.25 |
| 2009 | 18 | 21.83 | 7.59 | 1/19 | 388/169 | 51.08 | 142.55 |
| 2010 | 18 | 26.58 | 8.10 | 1/30 | 535/178 | 56.64 | 178.22 |
| 2011 | 19 | 30.23 | 7.98 | 2/29 | 540/169 | 55.54 | 167.05 |
| 2012 | 18 | 21.41 | 7.59 | 1/14 | 406/185 | 52.54 | 151.88 |
Another big difference so far this season compared to the last one is the ratio of matches won by the teams batting first. In the early part of last season, batting first was a wretched option - only five of the first 19 matches were won by the team defending a total. (By the end of the tournament last year, the teams batting first had a 32-40 win-loss record.) This year, teams batting first have done much better, winning ten out of 18 matches.
However, captains have struggled to make the right call after winning the toss this year: only six out of 18 games have been won by the team which won the toss. In the last three seasons, the team winning the toss had won more matches than they'd lost. This season, many captains have continued to field first after winning the toss, but without much success - out of the 12 times when they've fielded first, they've won only four games.
| Season | Played | Wins/losses | W/L ratio | Bat RR/Bowl ER | RR diff | Bat avg/Bowl avg | Avg diff |
| 2008 | 16 | 5/11 | 0.45 | 8.43/8.64 | -0.21 | 23.77/32.30 | -8.53 |
| 2009 | 18 | 9/8 | 1.12 | 7.79/7.38 | 0.41 | 22.09/21.53 | 0.56 |
| 2010 | 18 | 9/8 | 1.12 | 8.23/7.97 | 0.26 | 26.95/26.19 | 0.76 |
| 2011 | 19 | 5/14 | 0.35 | 7.78/8.19 | -0.41 | 26.65/35.00 | -8.35 |
| 2012 | 18 | 10/8 | 1.25 | 7.84/7.32 | 0.52 | 21.68/21.11 | 0.57 |
When 20-over cricket first started, there was fear regarding the future of the spinner in a format which is built around fours and sixes. As it turned out, spinners have held their own very well, and are increasingly playing a bigger role in matches, especially in conditions which aid slow bowling. The stats for pace and spin over the five seasons indicates that spinners are bowling more overs every season: in the first 16 matches in 2008 they contributed just 22% of the overs; in 2012, that percentage has risen to almost 41%. Their contribution of wickets has increased more modestly, but their bigger contribution has been in keeping the runs in check - their economy rate has been better than that of the fast and medium-fast bowlers in every season.
| Season | Pace (Over %) | Pace (wickets %) | Pace (ER/avg) | Spin (Over %) | Spin (wickets %) | Spin (ER/avg) |
| 2008 | 75.88 | 67.72 | 8.32/29.73 | 22.31 | 20.63 | 8.02/27.69 |
| 2009 | 64.77 | 61.30 | 7.77/23.60 | 35.22 | 28.69 | 6.79/23.95 |
| 2010 | 63.55 | 53.99 | 8.29/32.00 | 34.29 | 29.10 | 7.31/28.24 |
| 2011 | 61.04 | 57.67 | 7.92/31.77 | 38.81 | 32.80 | 7.61/34.12 |
| 2012 | 59.13 | 58.02 | 7.67/22.04 | 40.86 | 30.45 | 7.05/26.67 |
More numbers from IPL 2012
31 - Murali Vijay's tally in five innings this season. He has faced 48 balls for his runs, which gives him an average of 6.20 and a strike rate of 64.58. In his two previous IPL seasons Vijay had scored 892 runs in 31 innings at an average of 30.75 and a strike rate of 141.36.
31 - Murali Vijay's tally in five innings this season. He has faced 48 balls for his runs, which gives him an average of 6.20 and a strike rate of 64.58. In his two previous IPL seasons Vijay had scored 892 runs in 31 innings at an average of 30.75 and a strike rate of 141.36.
25.58 - The average opening partnership in IPL 2012 so far, at a run rate of 7.38 runs per over. Rajasthan Royals have scored the most runs - 192 in five innings - while Kings XI Punjab have struggled the most, scoring 59 partnership runs in four innings.
8.87 - The average run-rate between overs 14.1 and 20 in the IPL this season. Rajasthan Royals average 10.38 with the bat in the last six, the highest among all teams. Among the bowling teams, Royal Challengers have conceded 10.87 runs per over, and Deccan Chargers 11.41.
6.94 - The combined economy rate for Zaheer Khan, Muttiah Muralitharan and Daniel Vettori in this IPL season. In 47 overs, they've taken 16 wickets and conceded 326 runs, for an average of 20.37.
11.12 - The combined economy rate for the rest of the Royal Challengers' bowlers, apart from the three names mentioned above. Together, they've taken five wickets in 33 overs conceding 367 runs, at an average of 73.40 runs per wicket.
204 - The total runs scored by Owais Shah in five IPL matches for Rajasthan Royals this season. In three previous IPL seasons he had scored only 141 runs in all, and played just seven innings.
118 - R Ashwin's bowling average so far this season. He has taken one wicket in 18.2 overs, at an economy rate of 6.43. In his previous three IPL seasons he had taken 35 wickets at 19.82.
20.10 - The combined average for Suresh Raina and MS Dhoni in the tournament so far, at a strike rate of 117. In previous seasons they had a combined average of 37.65, and a combined strike rate of 139.57.