The year of the wicketkeeper-batsman
Led by Jonny Bairstow and Quinton de Kock, wicketkeepers have averaged 40.79 in Tests in 2016, the highest in a calendar year since 1900
S Rajesh
Dec 2, 2016, 5:30 AM
Wicketkeeper-batsmen have averaged more in Tests in 2016 than they did in any year since 1900 • ESPNcricinfo Ltd
With two Tests still to go for England in 2016, Jonny Bairstow has already racked up 1355 runs from 15 Tests, the most by any wicketkeeper in a calendar year; in fact, he needs just 127 from the last two Tests to become the highest run-getter for England in a calendar year. (Michael Vaughan currently holds the record with 1481.) Meanwhile, Quinton de Kock has been on a roll of his own, with six 50-plus scores in 11 Test innings, including two hundreds. This includes a five-innings sequence that reads thus: 82, 50, 84, 64, 104. His Test average for the year is 65.44.
Add to this the useful contributions by BJ Watling, Wriddhiman Saha and Shane Dowrich, and it's clear that 2016 has been a pretty useful year for wicketkeepers with the bat in Test cricket - even Parthiv Patel grabbed his chance in Mohali with scores of 42 and 67 not out.
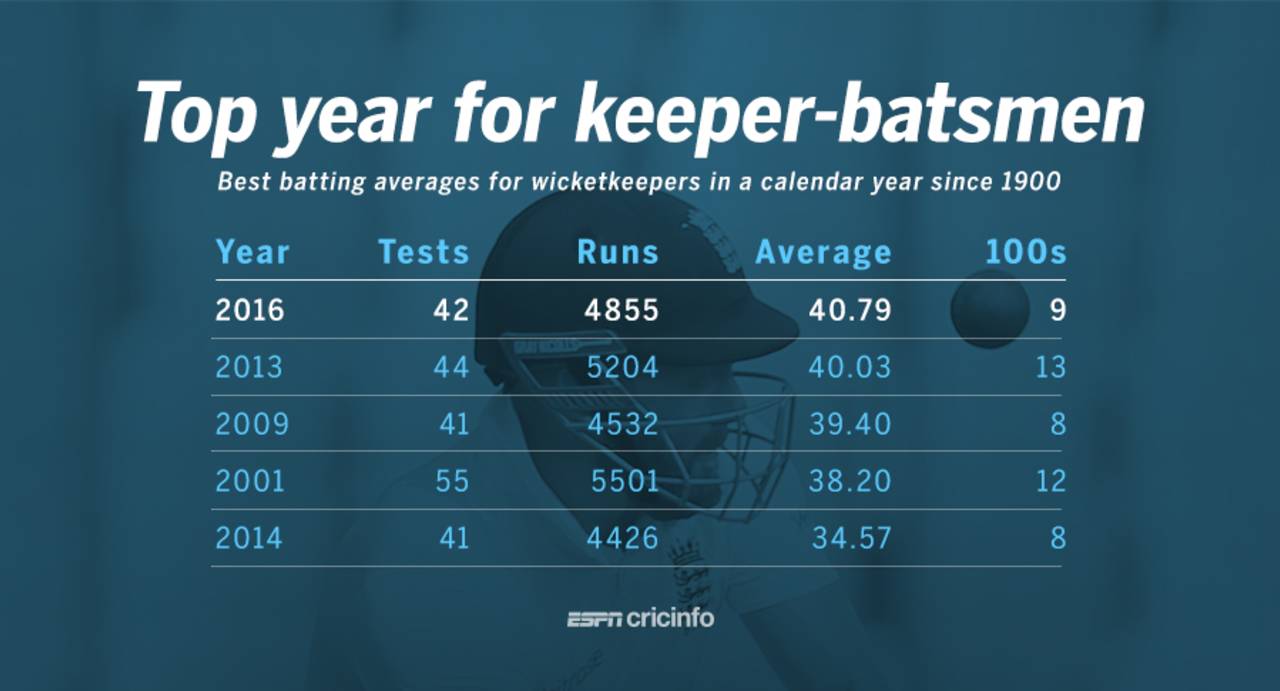
"Pretty useful" is an understatement, for the overall average of 40.79 for wicketkeepers in 2016 is the highest for any calendar year since 1900. In the history of Tests, there has been only one year when wicketkeepers had a higher average, and that was 119 years ago, in 1897, when just one Test was played and the wicketkeepers averaged 45. The next six entries are all since 2000, but in 2015 the average was just 30.81, which means so far this year the average is 32% higher than last year.
| Year | Tests | Runs | Average | 100s | 50s |
| 2016 | 42 | 4855 | 40.79 | 9 | 26 |
| 2013 | 44 | 5204 | 40.03 | 13 | 29 |
| 2009 | 41 | 4532 | 39.40 | 8 | 25 |
| 2001 | 55 | 5501 | 38.20 | 12 | 26 |
| 2014 | 41 | 4426 | 34.57 | 8 | 22 |
| 2007 | 31 | 2965 | 34.47 | 3 | 23 |
| 1996 | 28 | 2821 | 34.40 | 6 | 11 |
| 1972 | 14 | 1232 | 34.22 | 1 | 9 |
| 1975 | 16 | 1533 | 34.06 | 1 | 13 |
| 2012 | 42 | 3785 | 33.20 | 5 | 16 |
The two wicketkeepers who have been at the forefront of this bounty year are Bairstow and de Kock. Bairstow has been on a record-breaking spree with the bat and gloves this year - his 68 dismissals in Tests this year is also the highest by a wicketkeeper in any calendar year - while de Kock has been stellar with the bat not only in Tests but also in ODIs, scoring 857 runs at an average of 57 and a strike rate of 109 in 17 ODI innings.
Watling, who averaged 48.72 in Tests in 2015, has had another good year with the bat, averaging 42.61 (though his 107 and 83 not out against Zimbabwe has helped lift the average considerably). Saha has lifted his game too, averaging 40.66 this year after struggling a bit in 2015, when the average dipped to 23.18 in eight Tests. West Indies' brave move to bring in Dowrich to replace Denesh Ramdin has brought in batting benefits too. Dowrich has averaged 38.37 this year, compared to Ramdin's average of 20.72 from 17 Tests in 2014 and 2015.
While most wicketkeepers have been among the runs, a couple have missed out. Peter Nevill, no longer in favour with Australia's selectors, managed only 195 runs in 13 innings, at 17.72, while Dinesh Chandimal has had a lean year as well, with seven sub-20 scores in nine innings when he has played as wicketkeeper. Sarfraz Ahmed came down a few notches too from his batting standards of 2014-15, averaging only 30.42 this year compared to 60.35 in the previous two years.
| Player | Inns | Runs | Average | Strike rate | 100s |
| Jonny Bairstow | 25 | 1355 | 64.52 | 58.86 | 3 |
| Quinton de Kock | 11 | 589 | 65.44 | 80.68 | 2 |
| BJ Watling | 17 | 554 | 42.61 | 49.42 | 1 |
| Sarfraz Ahmed | 15 | 426 | 30.42 | 69.60 | 0 |
| Wriddhiman Saha | 11 | 366 | 40.66 | 47.71 | 1 |
| Shane Dowrich | 10 | 307 | 38.37 | 56.74 | 0 |
In all of Test history, there have only been eight instances of wicketkeepers scoring 500-plus Test runs in a calendar year at a 60-plus average; two of those eight instances have happened in 2016. Andy Flower was the first to do this, in 2000 and 2001, and Adam Gilchrist in 2002. He nearly achieved it again when he averaged 59.50 in 2003.
Matt Prior did it in 2011, not only averaging nearly 65, but also doing it at a strike rate of 89, the highest among these eight instances. (Gilchrist's strike rate in 2002 was 88.98, and de Kock's this year is 80.68). AB de Villiers and Sarfraz achieved it too in 2013 and 2014, but never before have two wicketkeepers done it in a year.
Both Bairstow and de Kock can expect to play some more Tests till the end of the year, and will have to score runs to ensure their average stays above 60. Bairstow needs 145 runs if he gets out four times in the two remaining Tests England play, while de Kock needs 71 in two innings in the Boxing Day Test. Given the form they have been in in 2016, you wouldn't bet against either.
S Rajesh is stats editor of ESPNcricinfo. Follow him on Twitter.