England's thrilling habit
Teams that played the most consecutive one-day internationals with close finishes
Travis Basevi and George Binoy
23-Mar-2011
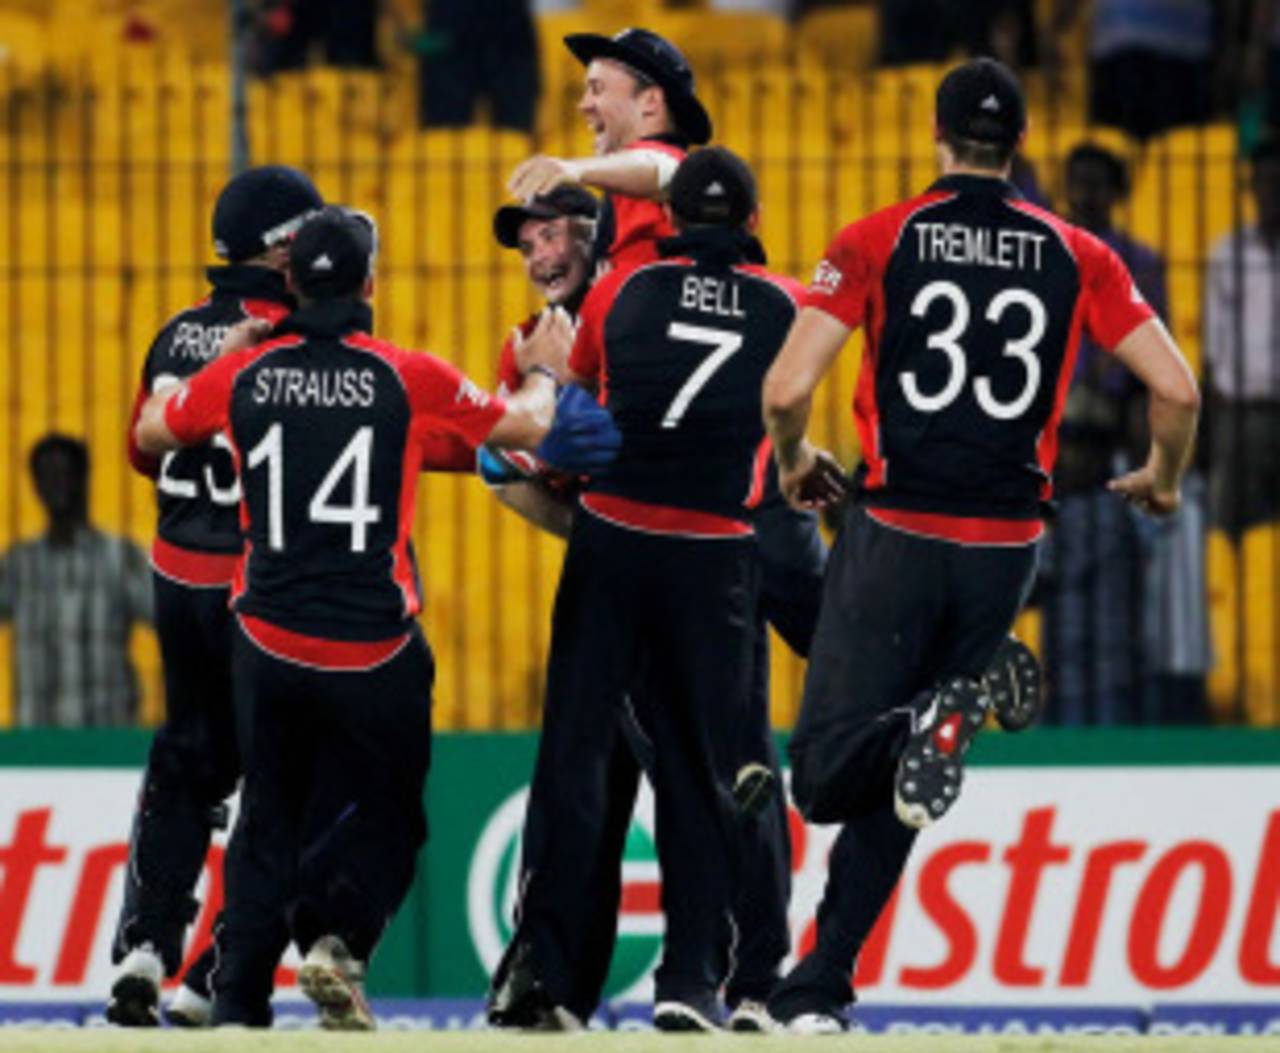
Can Andrew Strauss's men make it six thrillers in a row? • Getty Images
"If we take a reasonable definition of a 'close" one-day match (a tie; victory by 20 runs or fewer; victory by three wickets or fewer; victory by more wickets but in the last over), then which team has been involved in the most consecutive close ODIs?" asked a reader, Michael Jones, presumably inspired by England's chaotic run in the World Cup. So we decided to look it up.
To make sense of those parameters, 337 of the 1468 one-day games (22.96%) won by the side batting first have been by 20 runs or fewer, and 353 of the 1544 matches (22.80%) won by the side chasing by three wickets or fewer, or six balls or fewer. Which makes the probability of a team stringing together several such matches rather low. We've also reduced the result margins to 10 runs, two wickets, or three balls, which is roughly 13% of matches, to produce a list of consecutive extremely close ODIs.
England's 2011 campaign started with a laborious victory against Netherlands, a result that missed making our cut by two balls. After that nervous win, the thrills began. England tied with India, were beaten by Ireland with five balls to spare, pipped South Africa by six runs, lost to Bangladesh by two wickets, and beat West Indies by 18 runs. One tight game followed by five consecutive heart-stoppers. Never before had a team played so many close games in the same tournament.
This England team's streak of close finishes, however, is not the longest; though Andrew Strauss's side could draw level with Graham Gooch's team on six consecutive close games if the quarter-final against Sri Lanka is a thriller. In 1991, England under Gooch played six ODIs that had tight finishes, though they were spread out over five months. It began in Australia with a three-run defeat at the MCG in January, continued during the three-ODI series in New Zealand and ended at home, with a nine-run victory against West Indies in May.
Click here for the whole table.
Between January and March 1987, India were involved in four matches that had close finishes, the last of which illustrated how complex the rules and playing conditions of cricket can be. India were hosting Pakistan in Hyderabad, and the visitors needed two off the final ball, which Kapil Dev bowled to Manzoor Elahi. It should have been a no ball but the umpires failed to spot that only three Indian fielders were in the circle and Abdul Qadir was run out attempting an impossible second run, leaving the scores level on 212. India were ruled winners because they had lost fewer wickets - six to Pakistan's seven. The irony was that had Qadir not attempted the winning run, Pakistan would have won because of a playing condition which stipulated that if the runs scored and the number of wickets lost were equal, then the team that had scored more runs after 25 overs was the winner.
Scotland's run of six close matches in the table above holds even if we tighten the criteria and make the margins of victory and defeat smaller. Between January and February 2007, Scotland played six consecutive ODIs in Kenya that were decided by margins of 10 runs, two wickets, three balls remaining or fewer. The first three were part of an Associate tri-series also involving Kenya and Canada, while the last three were in the ICC World Cricket League Division One. Scotland won five of those games, losing only to Kenya by six runs.
| Team | Mat | Won | Lost | Tied | Start Match | End Match | ||
|---|---|---|---|---|---|---|---|---|
| Scotland | 6 | 5 | 1 | 0 | Jan 18, 2007 | Feb 2, 2007 | ||
| won 2w+1b v Can, lost 6 runs v Kenya, won 2w+16b v Can, won 3w+0b v Ire, won 7 runs v Can, won 2 runs v Neth | ||||||||
| England | 4 | 2 | 2 | 0 | Feb 13, 1991 | May 25, 1991 | ||
| lost 9 runs v NZ, lost 7 runs v NZ, won 1w+32b v WI, won 9 runs v WI | ||||||||
| Ireland | 4 | 0 | 3 | 1 | Feb 2, 2007 | Mar 15, 2007 | ||
| lost 1w+6b v Kenya, lost 6w+2b v Can, lost 6 runs v Neth, tied v Zim | ||||||||
| New Zealand | 3 | 1 | 2 | 0 | Dec 9, 1980 | Dec 23, 1980 | ||
| lost 5 runs v India, won 3w+2b v India, lost 6 runs v India | ||||||||
| West Indies | 3 | 0 | 2 | 1 | Dec 6, 1991 | Dec 14, 1991 | ||
| tied v India, lost 9 runs v Aus, lost 10 runs v India | ||||||||
| India | 3 | 0 | 3 | 0 | Jan 20, 1992 | Mar 1, 1992 | ||
| lost 6 runs v Aus, lost 9 runs v Eng, noresult v SL, lost 1 runs v Aus | ||||||||
| Australia | 3 | 2 | 1 | 0 | Mar 27, 1993 | May 19, 1993 | ||
| lost 3w+2b v NZ, won 3 runs v NZ, won 4 runs v Eng | ||||||||
| India | 3 | 1 | 2 | 0 | Jul 25, 1993 | Aug 14, 1993 | ||
| won 1 runs v SL, lost 8 runs v SL, lost 4w+3b v SL | ||||||||
| Sri Lanka | 3 | 2 | 1 | 0 | Jul 25, 1993 | Aug 14, 1993 | ||
| lost 1 runs v India, won 8 runs v India, won 4w+3b v India | ||||||||
| West Indies | 3 | 1 | 2 | 0 | Mar 14, 1996 | Mar 29, 1996 | ||
| lost 5 runs v Aus, won 1w+5b v NZ, lost 4w+1b v NZ | ||||||||
| England | 3 | 0 | 3 | 0 | Sep 1, 1996 | Jan 1, 1997 | ||
| lost 2w+2b v Pak, lost 2w+37b v Zim, lost 7 runs v Zim | ||||||||
| South Africa | 3 | 2 | 1 | 0 | Jan 26, 2000 | Feb 4, 2000 | ||
| won 1 runs v Eng, lost 2w+0b v Zim, won 2w+2b v Eng | ||||||||
| India | 3 | 1 | 2 | 0 | Mar 15, 2000 | Mar 19, 2000 | ||
| lost 2w+6b v SA, won 4w+1b v SA, lost 10 runs v SA | ||||||||
| South Africa | 3 | 2 | 1 | 0 | Mar 15, 2000 | Mar 19, 2000 | ||
| won 2w+6b v India, lost 4w+1b v India, won 10 runs v India | ||||||||
| India | 3 | 0 | 3 | 0 | Jan 31, 2002 | Mar 7, 2002 | ||
| lost 2 runs v Eng, lost 5 runs v Eng, lost 1w+2b v Zim | ||||||||
Click here for the whole table.
Travis Basevi is a cricket statistician and UK Senior Programmer for Cricinfo and other ESPN sports websites. George Binoy is an Assistant Editor at ESPNcricinfo