Garner and other bowling giants
Even in his own era, Big Bird towered over everyone else as an ODI bowler
S Rajesh
21-Nov-2011
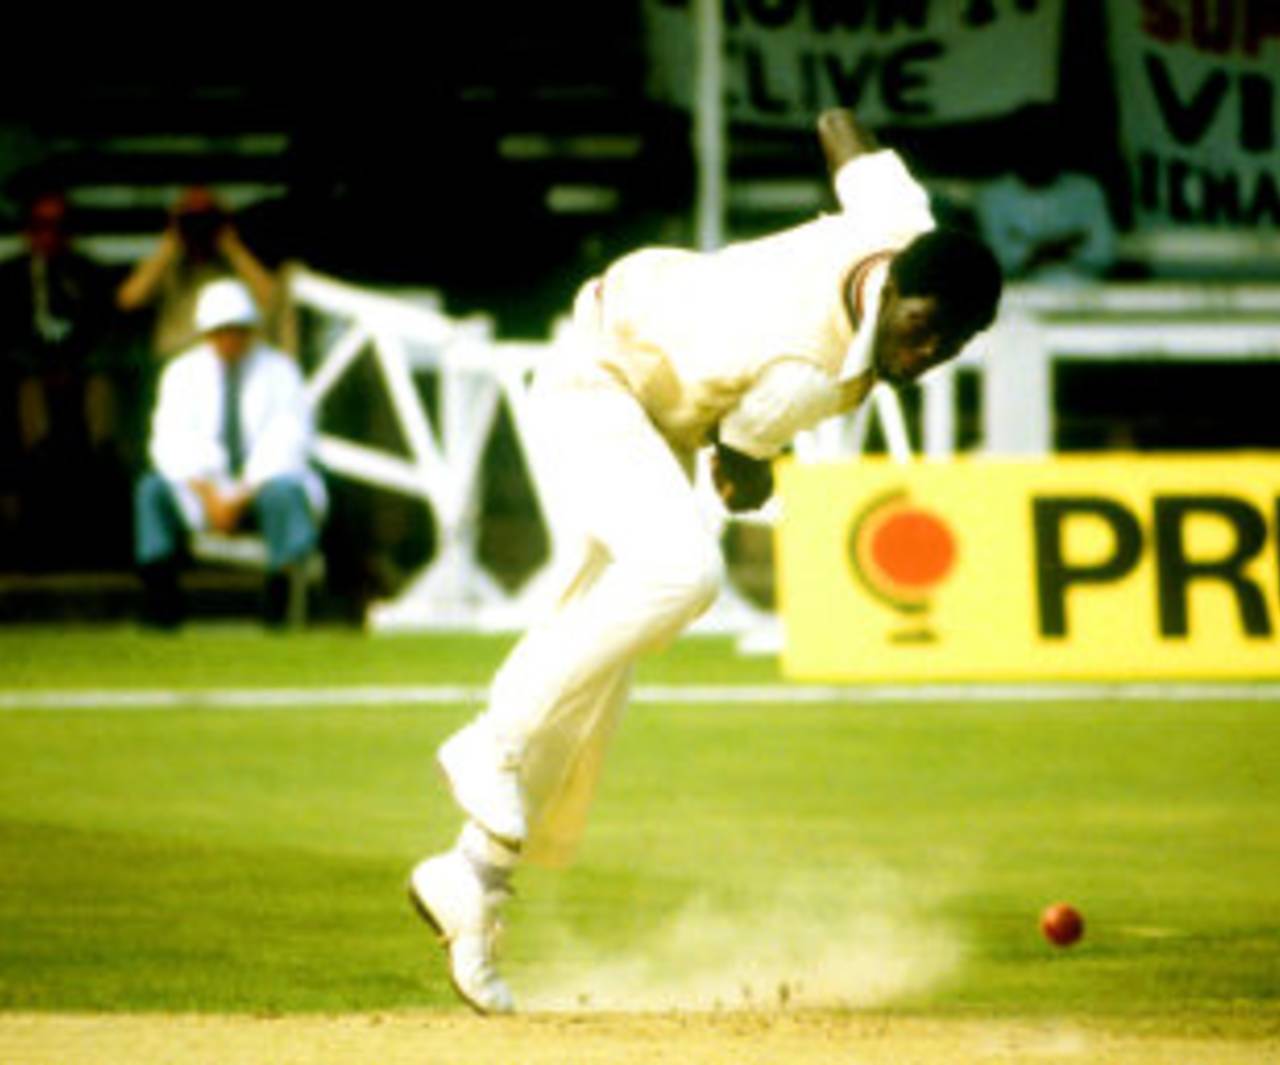
Surviving against Joel Garner was tough enough; scoring quickly was almost impossible • PA Photos
The previous Stats from the Past looked at the best batsmen from different eras of ODI cricket; this time the focus shifts to the bowlers. They're the breed that has always, rather unfairly, played second fiddle in the shorter forms of the game, so here's an attempt to give them the credit they deserve.
Any analysis of players in ODIs must take into account the period during which they performed, for the game has changed significantly since its early years in the 1970s. Then, bowlers could afford to bowl like they did in Tests, secure in the knowledge that batsmen would largely stick to orthodox shots, and that the little bits of innovative strokeplay would only come towards the end of an innings.
In today's version of ODIs, the bowler has no such luxury. Most pitches are loaded in favour of the batsmen, the shorter boundaries help too, especially when fielding restrictions are in place for 40% of the overs, and batsmen have realised that 10 wickets in hand for 50 overs of batting is an equation loaded in their favour. More risks are being taken earlier in the innings, and that's reflected in the kind of totals that have become the norm these days. The decade-wise ODI stats tell the story: in the 1970s, bowlers averaged 27.13 runs per wicket and conceded 3.67 runs per over, on average. Since the beginning of 2010, the economy rate has gone up to 4.91, an increase of 33%. The bowling average has remained more or less constant since the 1980s, but the increase in run rates has changed the benchmark for what's acceptable and what isn't.
To capture that change in the analyses here, the stats for each bowler are assessed against the overall numbers during the period in which he played. During the period in which Joel Garner played his 98 matches, for instance, the overall bowling average was 29.60, and the economy rate was four runs per over. Even against those benchmarks, though, Garner was terrific, averaging less than 19 runs per wicket at a stunning economy rate of 3.09. Multiplying the bowling average and the runs conceded per ball, his bowling index was 9.70, while the overall index during that period was 19.73. Dividing one by the other, it emerges that Garner's index was twice as good as that of the average bowler during the period in which he played.
Even compared to the other great bowlers who played during that era - and there were several - Garner was far ahead of the rest of pack. His height was an obvious advantage, and his unerring accuracy meant that the batsmen had to take all the risks to get him away for runs. Richard Hadlee is next among bowlers of that era, though his ratio is a fair bit lower than that of Garner. Four other top-class bowlers follow them in the table, which isn't much of a surprise, but what is mildly surprising is that Malcolm Marshall's bowling average in ODIs was only 26.96. The norm is for bowlers to have a lower average in ODIs than in Tests, for it's easier to get cheap wickets when batsmen are going for quick runs, but Marshall bucked that trend - his Test average of 20.94 was more than six runs fewer than his ODI one.
Another bowler with similar numbers was Imran Khan. Like Marshall, he is recognised as among the greatest fast bowlers in Test history - he averaged 22.81 in that format - but in ODIs he conceded 26.61 runs per wicket. Both are legends in each format of the game, but they shone a little brighter in Tests than in one-day internationals.
Three of the four great allrounders of the 1980s are mentioned in the table below; the fourth, Ian Botham, had a slightly lower ratio: he averaged 28.54 at an economy rate of 3.96, in an era when the corresponding figures were 30.92 and 4.13. His ratio, thus, came to 1.13, a tad poorer than those of Kapil Dev and Imran.
| Bowler | Matches | Wickets | Ave/ ER | Ave*ER/6 | Overall ave/ ER | Overall ave*ER/6 | Ratio |
| Joel Garner | 98 | 146 | 18.84/ 3.09 | 9.70 | 29.60/ 4.00 | 19.73 | 2.03 |
| Richard Hadlee | 115 | 158 | 21.56/ 3.30 | 11.86 | 30.58/ 4.09 | 20.85 | 1.76 |
| Michael Holding | 102 | 142 | 21.36/ 3.32 | 11.82 | 29.48/ 3.99 | 19.60 | 1.66 |
| Andy Roberts | 56 | 87 | 20.35/ 3.40 | 11.53 | 28.66/ 3.87 | 18.49 | 1.60 |
| Dennis Lillee | 63 | 103 | 20.82/ 3.58 | 12.42 | 28.59/ 3.88 | 18.49 | 1.49 |
| Malcolm Marshall | 136 | 157 | 26.96/ 3.53 | 15.86 | 31.26/ 4.17 | 21.73 | 1.37 |
| Ewen Chatfield | 114 | 140 | 25.84/ 3.57 | 15.37 | 30.71/ 4.11 | 21.04 | 1.37 |
| Kapil Dev | 225 | 253 | 27.45/ 3.71 | 16.97 | 31.12/ 4.14 | 21.47 | 1.27 |
| Abdul Qadir | 104 | 132 | 26.16/ 4.06 | 17.70 | 31.68/ 4.19 | 22.12 | 1.25 |
| Imran Khan | 175 | 182 | 26.61/ 3.89 | 17.25 | 30.78/ 4.12 | 21.14 | 1.23 |
Through that period in the 1970s, '80s and early '90s, the overall scoring rates were so low that the overall bowling indexes (bowling average multiplied by runs conceded per ball) stayed in the 18-21 range for bowlers who bowled in that era. For those who started their careers in the late '80s and bowled mostly in the 1990s, though, that index started moving towards the mid-20s, finding a range between 22 and 24. The averages didn't increase that much, but the scoring rates shifted upwards to around 4.5 runs per over. The bowlers who played in that era, thus, need to be compared against that benchmark.
There were several top-flight bowlers who were around during this period, as the table below shows. In terms of stats, the one who did better than everyone else was, again, a tall fast bowler from the West Indies. Curtly Ambrose's bowling average wasn't exceptional - 24.12 was very good, but there were a few others who did better - but the economy rate of 3.48 was terrific, especially when the overall rate during his period was 4.27.
Allan Donald's strength was his wicket-taking ability - he averaged 21.78 runs per wicket, which is why, even though his economy rate was more than four, he still has an excellent index. And then there was Saqlain Mushtaq, who, unlike a couple of names mentioned above, was definitely a more formidable bowler in ODIs: he matched Donald's average in the shorter version but averaged almost 30 in Tests. His ability to bowl the doosra, and his variations in speed and flight, meant he even bowled in the slog overs with plenty of success. His overall index and ratio are a shade better than even Wasim Akram's, which indicates just how proficient he was in ODIs. Among spinners, only Muttiah Muralitharan did better.
Shane Warne is in the list too, but his career strike rate was only 36.3, compared to Saqlain's 30.4. Waqar Younis is the third Pakistan bowler in the table below, and while his average 23.84 is top-class, his economy rate of 4.68 isn't - it's poorer than the overall economy rate during that period, of 4.49.
| Bowler | Matches | Wickets | Ave/ ER | Ave*ER/6 | Overall ave/ ER | Overall ave*ER/6 | Ratio |
| Curtly Ambrose | 176 | 225 | 24.12/ 3.48 | 13.99 | 32.64/ 4.27 | 23.23 | 1.66 |
| Allan Donald | 164 | 272 | 21.78/ 4.15 | 15.06 | 32.45/ 4.51 | 24.39 | 1.62 |
| Saqlain Mushtaq | 169 | 288 | 21.78/ 4.29 | 15.57 | 32.44/ 4.59 | 24.82 | 1.59 |
| Wasim Akram | 356 | 502 | 23.52/ 3.89 | 15.25 | 32.37/ 4.45 | 24.01 | 1.57 |
| Craig McDermott | 138 | 203 | 24.71/ 4.03 | 16.60 | 32.16/ 4.25 | 22.78 | 1.37 |
| Shane Warne | 194 | 293 | 25.73/ 4.25 | 18.23 | 32.51/ 4.57 | 24.76 | 1.36 |
| Waqar Younis | 262 | 416 | 23.84/ 4.68 | 18.60 | 32.41/ 4.49 | 24.25 | 1.30 |
And then there's the current era of bowlers, who've bowled mainly in the 2000s. It's a period that has been dominated by batsmen, which is apparent in the kind of numbers they've posted. The averages haven't gone up much, but the run rates have increased to around 4.7. That's reflected in the overall bowling index numbers - the product of the bowling average and the runs conceded per ball is more than 25 during the career spans of all the bowlers listed below.
Glenn McGrath and Murali are the two among them who played a fair amount in the 1990s as well, but both of them played less than 50% of their total games in the 1990s. McGrath played 101 out of his 250 matches in the '90s, while for the Murali the number was 129 out of 350.
Both McGrath and Murali are among the top four bowlers in the table, with numbers that are clearly superior to the rest in the list. McGrath, Murali and Shaun Pollock all had economy rates of less than four, which is truly remarkable considering the era they bowled in. Shane Bond, the other bowler in the top four, had an economy rate of 4.28, but he more than made up for that with his wicket-taking ability: his average of 20.88 is bettered only by two bowlers (with a 100-wicket cut-off), both of them legends.
A few other leading wicket-takers in ODIs aren't in the list below, but they deserve an honourable mention. Chaminda Vaas is Sri Lanka's second-highest wicket-taker, and his 400 scalps came at an average of 27.53 and an economy rate of 4.18. Taking his era stats into account, his ratio works out to 1.32, which is better than the likes of Kapil Dev and Imran Khan. Daniel Vettori has an even better economy rate, of 4.12, but an average of 31.48 reduces his ratio to 1.17. Shoaib Akhtar has an excellent average of 24.97, but his economy rate of 4.76 is marginally on the high side. He still manages a fine ratio of 1.29. And here's how the two leading wicket-takers for India fared: Javagal Srinath had a ratio of 1.17 for his 315 wickets (average 28.08, economy rate 4.44), while Anil Kumble managed 1.12, a relatively low ratio largely due to an average of 30.89.
| Bowler | Matches | Wickets | Ave/ ER | Ave*ER/6 | Overall ave/ ER | Overall ave*ER/6 | Ratio |
| Glenn McGrath | 250 | 381 | 22.02/ 3.88 | 14.24 | 32.52/ 4.63 | 25.09 | 1.76 |
| Shane Bond | 82 | 147 | 20.88/ 4.28 | 14.89 | 32.30/ 4.82 | 25.95 | 1.74 |
| Shaun Pollock | 303 | 393 | 24.50/ 3.67 | 14.99 | 32.55/ 4.68 | 25.39 | 1.69 |
| Muttiah Muralitharan | 350 | 534 | 23.08/ 3.93 | 15.12 | 32.42/ 4.69 | 25.34 | 1.68 |
| Brett Lee | 205 | 357 | 22.89/ 4.70 | 17.93 | 32.31/ 4.79 | 25.79 | 1.44 |
| Nathan Bracken | 116 | 174 | 24.36/ 4.41 | 17.90 | 32.22/ 4.78 | 25.67 | 1.43 |
| Andrew Flintoff | 141 | 169 | 24.38/ 4.39 | 17.84 | 32.18/ 4.72 | 25.31 | 1.42 |
| Jason Gillespie | 97 | 142 | 25.42/ 4.21 | 17.84 | 32.52/ 4.64 | 25.15 | 1.41 |
| Makhaya Ntini | 173 | 266 | 24.65/ 4.53 | 18.61 | 32.36/ 4.72 | 25.46 | 1.37 |
These ratios have been worked out simply by multiplying batting average and runs conceded per ball, giving equal weightage to both factors. A slight tweak in weightages will alter the list somewhat, but the top ones will still remain unscathed. The list below combines all three eras and picks out the top ten ratios. You'll agree that it's difficult to pick holes with this table of 10 ODI bowlers.
| Bowler | Matches | Wickets | Ave/ ER | Ave*ER/6 | Overall ave/ ER | Overall ave*ER/6 | Ratio |
| Joel Garner | 98 | 146 | 18.84/ 3.09 | 9.70 | 29.60/ 4.00 | 19.73 | 2.03 |
| Glenn McGrath | 250 | 381 | 22.02/ 3.88 | 14.24 | 32.52/ 4.63 | 25.09 | 1.76 |
| Richard Hadlee | 115 | 158 | 21.56/ 3.30 | 11.86 | 30.58/ 4.09 | 20.85 | 1.76 |
| Shane Bond | 82 | 147 | 20.88/ 4.28 | 14.89 | 32.30/ 4.82 | 25.95 | 1.74 |
| Shaun Pollock | 303 | 393 | 24.50/ 3.67 | 14.99 | 32.55/ 4.68 | 25.39 | 1.69 |
| Muttiah Muralitharan | 350 | 534 | 23.08/ 3.93 | 15.12 | 32.42/ 4.69 | 25.34 | 1.68 |
| Curtly Ambrose | 176 | 225 | 24.12/ 3.48 | 13.99 | 32.64/ 4.27 | 23.23 | 1.66 |
| Michael Holding | 102 | 142 | 21.36/ 3.32 | 11.82 | 29.48/ 3.99 | 19.60 | 1.66 |
| Allan Donald | 164 | 272 | 21.78/ 4.15 | 15.06 | 32.45/ 4.51 | 24.39 | 1.62 |
| Andy Roberts | 56 | 87 | 20.35/ 3.40 | 11.53 | 28.66/ 3.87 | 18.49 | 1.60 |
S Rajesh is stats editor of ESPNcricinfo. Follow him on Twitter