Who are the biggest hitters in T20?
A look at the batsmen and bowlers with the best boundary and dot-ball stats in T20 internationals
S Rajesh
Sep 14, 2012, 3:14 AM
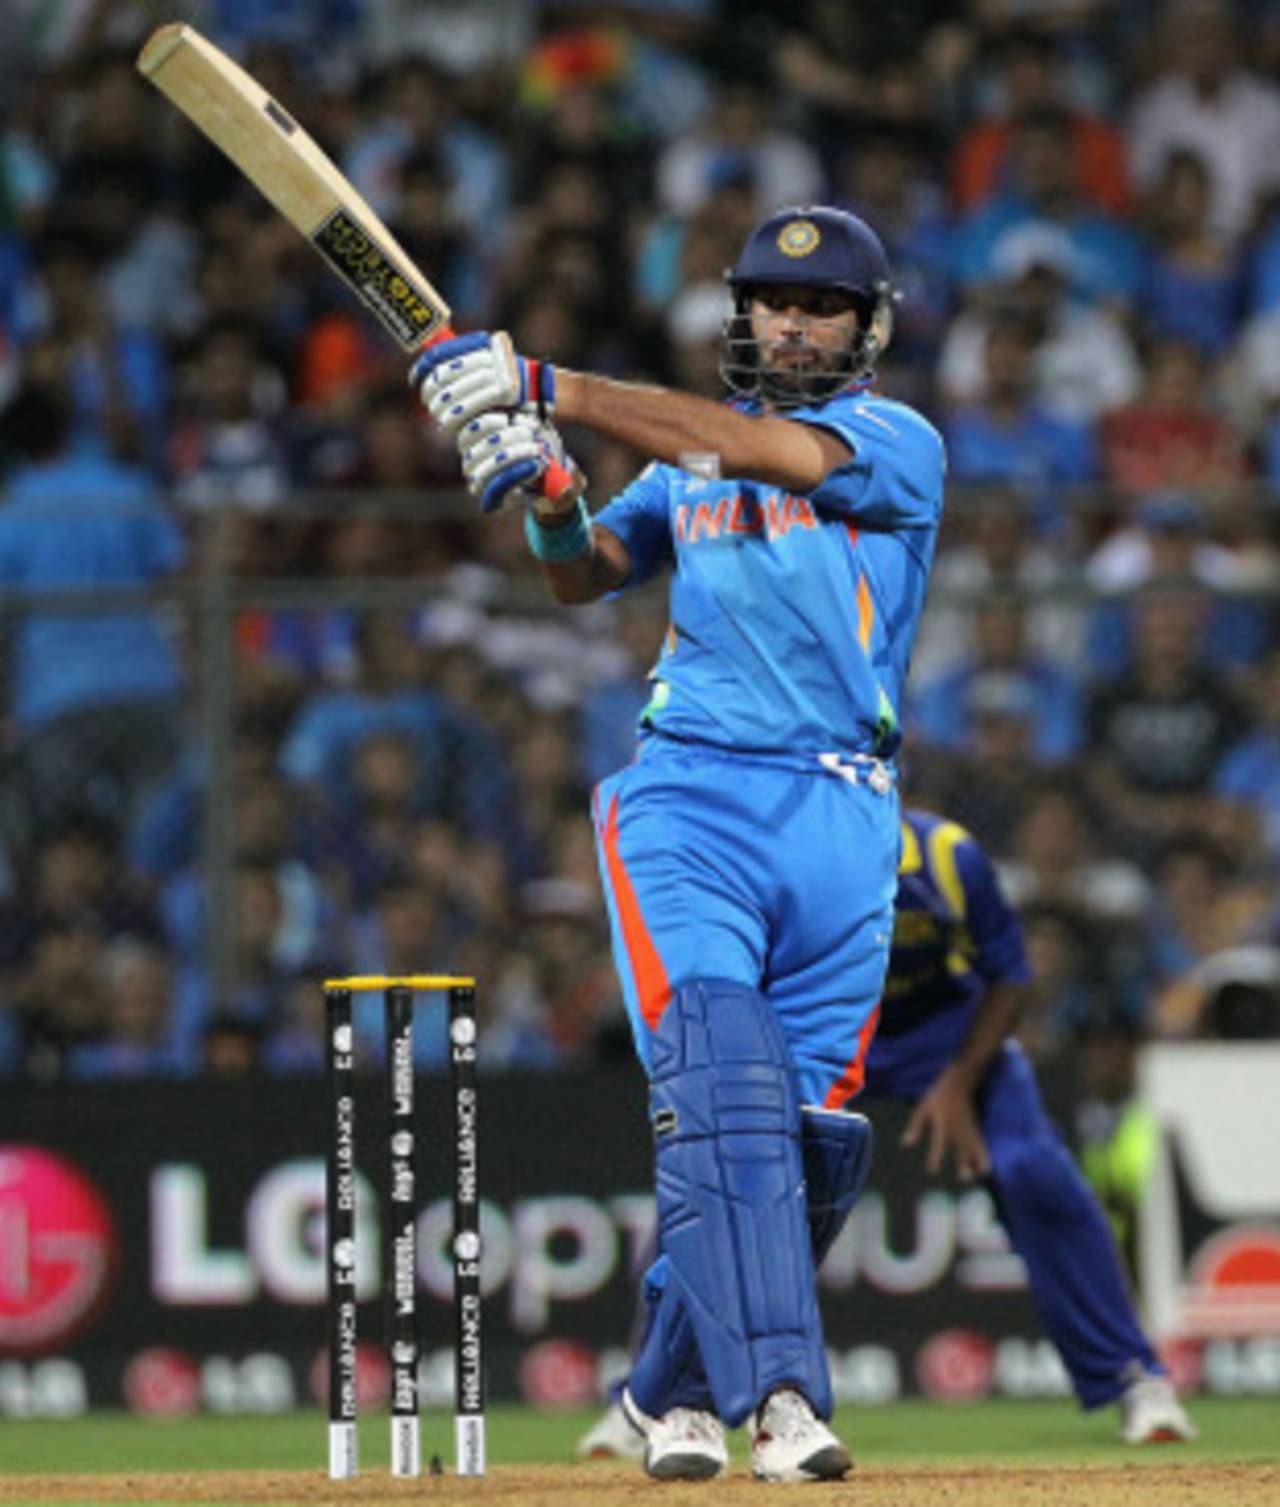
Yuvraj Singh is the only batsman to score 500-plus runs in T20 internationals at a strike rate of more than 150 • Getty Images
Over the last couple of years, T20 cricket has been all about clubs and franchises, with league tournaments mushrooming all over the world following the IPL's success. However, over the next three weeks, the focus shifts back to T20 cricket between countries. Here's a look at some of the top performers in T20 internationals, based not on the usual parameters of runs scored and wickets taken, the lists for which you can find here and here, but on ESPNcricinfo's ball-by-ball database, from which it's possible to get, among other numbers, dot-ball stats and batting and bowling performances during specific stages of a 20-over innings.
Dot-ball factor
In a format in which balls available are at a premium, those who waste the fewest deliveries are obviously a huge asset. The table below offers a reminder to England (if they ever needed one) and their fans of why Kevin Pietersen was such a key player: no batsman has a lower dot-ball percentage, among those who have scored 500 runs in T20 internationals. Out of 831 balls he faced, he went runless off only 255. Off the other 576 balls, he scored 119 fours and 32 sixes, and also took 348 singles, 71 twos and six threes.
In a format in which balls available are at a premium, those who waste the fewest deliveries are obviously a huge asset. The table below offers a reminder to England (if they ever needed one) and their fans of why Kevin Pietersen was such a key player: no batsman has a lower dot-ball percentage, among those who have scored 500 runs in T20 internationals. Out of 831 balls he faced, he went runless off only 255. Off the other 576 balls, he scored 119 fours and 32 sixes, and also took 348 singles, 71 twos and six threes.
Close behind him is Australia's Michael Hussey, whose dot-ball percentage is also outstandingly low. Both Hussey and Pietersen have achieved a low dot-ball percentage while maintaining averages of more than 30 - in Pietersen's case almost 38 - and a run rate of almost 8.50 per over.
The other player whose numbers stand out is Yuvraj Singh, who returns to the Indian team after winning his battle with germ-cell cancer. Yuvraj too averages more than 30, while his strike rate is the highest among batsmen who have scored 500 runs in T20 internationals.
| Batsman | Runs | Balls/ Dots | Average | Run rate | Dot ball % |
| Kevin Pietersen | 1176 | 831/ 255 | 37.93 | 8.49 | 30.69 |
| Michael Hussey | 566 | 403/ 126 | 33.29 | 8.42 | 31.27 |
| Shahid Afridi | 801 | 562/ 182 | 18.20 | 8.55 | 32.38 |
| Cameron White | 652 | 484/ 163 | 28.34 | 8.08 | 33.68 |
| Paul Collingwood | 583 | 459/ 155 | 18.80 | 7.62 | 33.77 |
| Yuvraj Singh | 601 | 400/ 139 | 31.63 | 9.01 | 34.75 |
| Mahela Jayawardene | 981 | 706/ 246 | 30.65 | 8.33 | 34.84 |
| Jacques Kallis | 642 | 525/ 185 | 40.12 | 7.33 | 35.24 |
| Suresh Raina | 658 | 477/ 169 | 32.90 | 8.27 | 35.43 |
| JP Duminy | 846 | 687/ 244 | 32.53 | 7.38 | 35.52 |
While those with the lowest dot-ball percentages are mostly middle-order batsmen, those who play the most dot balls are usually openers, since they bat when fielding restrictions are in place. (Thus they also get more opportunities to score runs in boundaries.)
The names on the list below are all of opening batsmen, with some of them not scoring off as many as 48% of the deliveries they face. The good ones are those who score plenty of runs off the deliveries that are not dots. Chris Gayle, for example, has a dot-ball percentage of 42.40, which is the sixth-highest among batsmen with 500-plus runs, but yet he scores 8.63 runs per over (strike rate 143.91). Mohammad Hafeez, on the other hand, only scores at 6.75 per over (strike rate 112.52) due to his relative lack of boundary hitting: 279 of his 575 deliveries are dots, and off the others he has struck 78 fours and 12 sixes, and taken 157 singles, 41 twos and eight threes.
| Batsman | Runs | Balls/ dots | Average | Run rate | Dot ball % |
| Mohammad Hafeez | 647 | 575/ 279 | 20.21 | 6.75 | 48.52 |
| Sanath Jayasuriya | 629 | 487/ 234 | 23.29 | 7.74 | 48.05 |
| Graeme Smith | 982 | 770/ 340 | 31.67 | 7.65 | 44.16 |
| Kamran Akmal | 778 | 619/ 271 | 25.09 | 7.54 | 43.78 |
| Salman Butt | 595 | 551/ 240 | 28.33 | 6.47 | 43.56 |
| Chris Gayle | 757 | 526/ 223 | 36.04 | 8.63 | 42.40 |
Boundary percentages
The list of batsmen with the highest percentage of runs in boundaries also has a few names who featured in the previous table. As mentioned earlier, it's most likely that openers will dominate this list, as there's less protection in the outfield when they are batting. However, there are a couple of non-openers who make it: Yuvraj combines a low dot-batting strike rate with a high percentage of runs in boundaries, which explains his outstanding strike rate and the fact that he is the only batsman to score 500-plus runs in T20 internationals at a strike rate of more than 150. Then there's Albie Morkel, who has scored crucial runs for South Africa down the order when there's little time to settle in. (Both Yuvraj and Morkel are among the select few who have struck more sixes than fours in Twenty20 internationals.)
The list of batsmen with the highest percentage of runs in boundaries also has a few names who featured in the previous table. As mentioned earlier, it's most likely that openers will dominate this list, as there's less protection in the outfield when they are batting. However, there are a couple of non-openers who make it: Yuvraj combines a low dot-batting strike rate with a high percentage of runs in boundaries, which explains his outstanding strike rate and the fact that he is the only batsman to score 500-plus runs in T20 internationals at a strike rate of more than 150. Then there's Albie Morkel, who has scored crucial runs for South Africa down the order when there's little time to settle in. (Both Yuvraj and Morkel are among the select few who have struck more sixes than fours in Twenty20 internationals.)
| Batsman | Runs | Average | Run rate | 4s/ 6s | Boundary % |
| Sanath Jayasuriya | 629 | 23.29 | 7.74 | 76/ 23 | 70.27 |
| Chris Gayle | 757 | 36.04 | 8.63 | 67/ 43 | 69.48 |
| Shane Watson | 731 | 27.07 | 8.87 | 56/ 47 | 69.22 |
| Graeme Smith | 982 | 31.67 | 7.65 | 123/ 26 | 65.99 |
| David Warner | 978 | 27.16 | 8.44 | 91/ 46 | 65.44 |
| Yuvraj Singh | 601 | 31.63 | 9.01 | 35/ 40 | 63.23 |
| Brendon McCullum | 1443 | 36.07 | 7.96 | 139/ 57 | 62.23 |
| Albie Morkel | 502 | 23.90 | 8.53 | 28/ 33 | 61.75 |
| Martin Guptill | 818 | 32.72 | 7.49 | 71/ 35 | 60.39 |
Examining the same set of stats between the 11th and 20th overs, the dot-ball percentages come down even further, to 23.81 for Michael Hussey, 25.26 for AB de Villiers, 26.02 for Dwayne Bravo and 26.43 for Suresh Raina. At the other end of the scale are Abdul Razzaq (36.84) and Kieron Pollard (34.39), both big hitters who believe fielders on the boundaries aren't a problem when the aim is to send the ball into the crowd.
MS Dhoni has a pretty high dot-ball percentage too in the middle overs, of 31.28% (which is the ninth-highest among batsmen who have scored 300-plus runs in the last ten overs). That, coupled with his relatively low boundary percentage of 43.65, means his run rate in the last ten overs is only 7.44. On the other hand, Yuvraj also has a relatively high dot percentage, of 30.68, but he scores 68% of his runs in boundaries, which lifts his run rate in these ten overs to 10.4 runs per over.
The bowlers
Dot-ball percentages
Just as minimising the dot-ball percentage is key for batsmen, maximising it is crucial for bowlers, to increase the pressure on batsmen and force them into errors. Among bowlers who have bowled at least 75 overs, South Africa's Morne Morkel has the highest dot-ball percentage, of 50.29. Not surprisingly, his economy rate and average are both excellent.
Just as minimising the dot-ball percentage is key for batsmen, maximising it is crucial for bowlers, to increase the pressure on batsmen and force them into errors. Among bowlers who have bowled at least 75 overs, South Africa's Morne Morkel has the highest dot-ball percentage, of 50.29. Not surprisingly, his economy rate and average are both excellent.
Trent Johnston in the second spot is a bit of a surprise, but his stats are obviously boosted by the fact that he has played a fair number of matches against the lesser teams. Most of the bowlers on the list below are new-ball bowlers, which you would expect, given that they bowl when the field restrictions are on, which gives them the best chance to bowl dots. Most of them also have an economy rate of less than seven, and averages of less than 22.
| Bowler | Balls | Wickets | Average | Econ rate | Dot % |
| Morne Morkel | 521 | 34 | 17.26 | 6.76 | 50.29 |
| Trent Johnston | 492 | 25 | 20.28 | 6.18 | 49.80 |
| Shane Bond | 465 | 25 | 21.72 | 7.00 | 48.82 |
| Dale Steyn | 498 | 31 | 17.87 | 6.67 | 46.99 |
| Mitchell Johnson | 609 | 36 | 20.11 | 7.13 | 45.32 |
| Sohail Tanvir | 459 | 21 | 25.47 | 6.99 | 45.32 |
| Stuart Broad | 795 | 41 | 23.70 | 7.33 | 44.28 |
| Umar Gul | 892 | 59 | 16.66 | 6.61 | 44.17 |
| Saeed Ajmal | 924 | 60 | 15.48 | 6.03 | 44.16 |
| Abdur Razzak | 461 | 29 | 17.96 | 6.78 | 44.03 |
Boundary percentages
The list of bowlers with the lowest percentage of runs in boundaries is dominated by spinners - and all of them high-class spinners who have learnt the art of bowling in 20-over cricket. Daniel Vettori leads the way, and has conceded more sixes than fours, which is perhaps a commentary on the size of the outfields in New Zealand as well. The one number in Harbhajan Singh's row that stands out is his average: while most of the others average less than 21, Harbhajan concedes 30 runs per wicket.
The list of bowlers with the lowest percentage of runs in boundaries is dominated by spinners - and all of them high-class spinners who have learnt the art of bowling in 20-over cricket. Daniel Vettori leads the way, and has conceded more sixes than fours, which is perhaps a commentary on the size of the outfields in New Zealand as well. The one number in Harbhajan Singh's row that stands out is his average: while most of the others average less than 21, Harbhajan concedes 30 runs per wicket.
| Bowler | Runs | Wickets | Average | Run rate | 4s/ 6s | Boundary % |
| Daniel Vettori | 617 | 35 | 17.62 | 5.50 | 18/ 20 | 31.12 |
| Harbhajan Singh | 541 | 18 | 30.05 | 6.44 | 23/ 14 | 32.53 |
| Graeme Swann | 742 | 44 | 16.86 | 6.39 | 25/ 26 | 34.50 |
| Ajantha Mendis | 444 | 39 | 11.38 | 5.69 | 26/ 11 | 38.29 |
| Shahid Afridi | 1141 | 57 | 20.01 | 6.10 | 72/ 30 | 41.02 |
| Johan Botha | 727 | 36 | 20.19 | 6.24 | 50/ 18 | 42.37 |
| Saeed Ajmal | 929 | 60 | 15.48 | 6.03 | 61/ 25 | 42.41 |
| Sohail Tanvir | 535 | 21 | 25.47 | 6.99 | 45/ 10 | 44.86 |
The three bowlers who have conceded the highest percentages of runs in boundaries are all New Zealanders, with two of them conceding more than eight per over. Shane Bond's overall economy rate is much lower, which is due to his high dot-ball percentage - even though he concedes a few boundaries, he compensates by keeping it tight otherwise.
| Bowler | Runs | Wickets | Average | Run rate | 4s/ 6s | Boundary % |
| Kyle Mills | 895 | 31 | 28.87 | 8.39 | 94/ 33 | 64.13 |
| Tim Southee | 773 | 28 | 27.60 | 8.49 | 82/ 26 | 62.61 |
| Shane Bond | 543 | 25 | 21.72 | 7.00 | 64/ 12 | 60.41 |
| Brett Lee | 714 | 28 | 25.50 | 7.86 | 77/ 17 | 57.42 |
| Albie Morkel | 674 | 20 | 33.70 | 7.94 | 48/ 30 | 55.19 |
| Morne Morkel | 587 | 34 | 17.26 | 6.76 | 49/ 21 | 54.86 |
| Jacob Oram | 669 | 14 | 47.78 | 8.63 | 63/ 19 | 54.71 |
| Stuart Broad | 972 | 41 | 23.70 | 7.33 | 95/ 25 | 54.53 |
S Rajesh is stats editor of ESPNcricinfo. Follow him on Twitter