
The analytical power of the halfway mark
Nearly a decade ago, I commenced my innings at Cricinfo with a hard-hitting article on how the Batting Average, a flawed measure in my opinion, even today, can be tweaked. There was a tremendous response and I am glad to say that I had more bouquets than brickbats. Since then I have modified that measure continuously, aided by excellent inputs from readers, and a very satisfactory and almost foolproof alternate measure, RpAI, is in place now. I am confident that the new measure I am going to present and discuss in this article will be an equally significant and pathbreaking one, when it comes to evaluating the progression of a completed Test innings.
Recently, there has been a lot of discussion on the contributions of lower-order batsmen. There is a feeling that there is a more effective contribution by lower-order batsmen nowadays. I wanted to do some work on this intriguing theme. The traditional methods are to use the wicket-fall situations and partnerships. These types of analyses have been done in plenty. Then one day, while having my shower, I had a brainwave, a la Archimedes. Why not use the halfway score as a reference point? Fortunately, unlike Archimedes, I stayed in the bathroom.
I have developed this concept further over the past couple of months. I can say honestly that I have never been so excited at the possibilities of a measure as I have been about this one. I have used it to look at innings and matches and the insights that can be derived are priceless. It is also very easy to understand, and derive, for the normal cricket follower.
The idea is simple. The measure - let us call it HWV (Halfway Wicket Value) - is the exact wicket equivalent of the innings when the halfway score was reached. The measure is applicable only to completed innings.
Say a team scores 410. The halfway mark is 205. When the score of 205 was reached, the fourth-wicket partnership was in progress. The third wicket fell at 180 and the fourth wicket at 270. The HWV value is 3.28 (3.0 + (205-180)/(270-180)).
In another innings, the team scores 283. The halfway mark is 142. When the score of 142 was reached, the seventh-wicket partnership was in progress. The sixth wicket fell at 131 and the seventh wicket, at 201. The HWV value is 6.16 (6.0 + (142-131)/(201-131)).
Let me put in a simple definition of HWV. A team scores "rrr for ww", in a completed innings. If the halfway mark is "hhh", the HWV is defined by the phrase "hhh for HWV", with HWV being the exact wicket-value, in decimals.
This measure, a ridiculously simple one indeed, packs a punch. It is a clear indicator of how the innings progressed. The lower HWV values indicate that there have been collapses by the middle- and lower-order batsmen. The high HWV values indicate recoveries by the lower-order batsmen. Let me illustrate this.

Let us say that the HWV is 0.91. There was a terrific first-wicket partnership, which exceeded the halfway score. Soon after the first wicket fell, there was a huge collapse of wickets and the last nine wickets contributed less than half of the score. Say the HWV is 2.42. The top order performed quite well and the team reached the halfway mark, two wickets down. There was a collapse of sorts and the last seven wickets did not contribute a lot - less than half of the score.
If the HWV was 6.91, there was loss of top-order wickets and the halfway mark was reached six down and the seventh wicket was lost soon afterwards. However the last three partnerships saved the day and added nearly half the final score. Let the HWV be 8.75. There was a huge top-order collapse and the ninth wicket fell soon after the halfway score was reached. The last-wicket stand played outstandingly well and helped reach the final score.
Note how we can weave a story of the innings just through inspection of the HWV. So much so, I have done this for each of the innings in the last five Tests and am amazed at how close to the mark I was. However, a lot more is possible. An inspection of the four HWV values of a Test provides a nice capsuled summary of what happened. Let me take a few Tests to demonstrate this.
The first tied Test, at the Gabba in 1960-61. The HWV sequence was WI-3.93, Aus-3.70, WI-4.18 and Aus-6.17. Without referring to the scorecard, I can say: Three fairly routine and well-paced innings, followed by a collapse of sorts and some very good middle- and lower-order batting in the fourth innings. Whether the result was a tie or a win for the first batting team really does not matter.
Australia versus West Indies at the Adelaide Oval in 1992-93: one of the greatest Tests of all time, won by a single run by West Indies over Australia. The HWV sequence was WI-2.90, Aus-3.98, WI-4.13 and Aus-7.64. What do I conclude? The first innings lacked contributions by the middle- and lower-order, then followed two very routine innings. The fourth innings was a terrific recovery by the lower-order batsmen.
A random Test, no. 1729, between Australia and Pakistan in 2004-05: my favourite number, of Ramanujan/Hardy fame. The HWV sequence was Pak-3.40, Aus-5.32, Pak-5.46. The first innings was a normal well-paced one. The next two innings had significant contributions by the lower-order batsmen. The fourth innings might not have existed or was an incomplete one.
Some caveats. The HWV is a relative index. When Australia was dismissed for 47, the halfway stage was 24. Whether the HWV was 1.9 or 9.1, it does not really matter. There was no real partnership of any kind. On the other hand, when Australia was all out for 701, their HWV was 1.73, indicating that they were well over 350 for 1. But this special HWV value should not make us forget that the last 8 wickets added nearly 300. The second important point is that there is no context. When a team was dismissed for 212, with a HWV of, say, 3.65, we do not know whether the team was chasing 215 or 500. These factors should be remembered before making sweeping statements after perusing HWV values. The third important point is that the HWV can only be developed at the end of the innings. Thus it is a post-facto analysis.
For quite some time I worked with innings in which nine or ten wickets had fallen. Then I realised that for a proper analysis to be done, I had to restrict myself to fully completed innings only, taking care to exclude innings which are deemed to be 'all-out', but fewer than ten wickets have fallen, due to many reasons. Hence this analysis is limited to innings in which all ten wickets have fallen. For instance, the first ever Test innings is not included since Charles Bannerman retired hurt. 5560 innings qualify, which works to about two-and-a-half innings per Test.
Now for some analytical tables. The first table lists ten Test innings in which the HWV values were below 0.80: In other words, the halfway mark was reached well before the fall of the first wicket and there were huge collapses afterwards. I will describe the top three innings only.
| Year | Inns | BatTeam | BowTeam | Score | Wkts | HalfScore | Winner | ||
|---|---|---|---|---|---|---|---|---|---|
| 1477 | 1999 | 1 | WIN | Nzl | 365 | 10 | 183 | 0.66 | Nzl |
| 277 | 1946 | 2 | IND | Eng | 170 | 10 | 85 | 0.69 | Draw |
| 1391 | 1997 | 2 | PAK | Win | 417 | 10 | 209 | 0.70 | Pak |
| 1533 | 2001 | 4 | NZL | Pak | 131 | 10 | 66 | 0.73 | Pak |
| 736 | 1974 | 4 | NZL | Aus | 158 | 10 | 79 | 0.74 | Aus |
| 1144 | 1990 | 2 | WIN | Eng | 446 | 10 | 223 | 0.75 | Win |
| 1316 | 1995 | 1 | PAK | Nzl | 208 | 10 | 104 | 0.77 | Pak |
| 2230 | 2016 | 2 | AUS | Saf | 244 | 10 | 122 | 0.77 | Saf |
| 1585 | 2002 | 2 | ZIM | Slk | 236 | 10 | 118 | 0.77 | Slk |
| 1859 | 2008 | 3 | BNG | Nzl | 254 | 10 | 127 | 0.79 | Nzl |
Once again, let us recap what a HWV of 0.66 communicates. It means that half the final score was reached about two-thirds of the way into the first-wicket stand. That means the remaining nine-plus wickets added half the runs. Just imagine this situation and the huge collapse that must have unfolded.
When West Indies toured New Zealand towards end of the twentieth century, Adrian Griffith and Sherwin Campbell put on 276 for the first wicket. From 276 for no loss, West Indies plummeted to 365 all-out. That means they reached 183 for the loss of 0.66 of a wicket and this is the HWV. The next-highest score was 24. As night follows day, West Indies collapsed in the second innings for 97 after conceding a first-innings lead and lost the Test by nine wickets. Imagine, going from 282 for 1 at the close of the first day to a humiliating nine-wicket loss.
In the first post-war series, India toured England. England's total of 294 was below par, primarily due to excellent bowling by Lala Amarnath and Vinoo Mankad. In response, India started with a terrific opening stand of 124 by Vijay Merchant and Mushtaq Ali. This leads to a HWV of 0.69 for the halfway score of 85. Unfortunately for India, Dick Pollard and Alec Bedser ran through the team, picking up ten wickets for 46 runs. India was set 278 to win and Alec Bedser was virtually unplayable, capturing 7 for 52. However the last-wicket pair of India held on for 13 minutes and India secured a very creditable draw.
The second Test between Pakistan and West Indies during the 1997 tour is the third featured match. Pakistan dismissed West Indies for 216 and they themselves were coasting at 298 for no loss. The last ten wickets produced only 119 runs. The HWV for the halfway score of 209 is 0.70. But West Indies produced an equally inept performance in their second innings and Pakistan won by ten wickets.
It is amazing to note that out of the ten Test innings which have had HWVs below 0.80, one Test was played in 1946, a second in 1974 and the other eight in the past 27 years. Out of these eight, four were played after the turn of the century. This indicates that a lot more collapses seem to have happened comparatively recently. I was quite intrigued by this. So much so that I analysed the sub-1.00 HWVs. Out of 82 such occurrences, 38 happened in the first 100 years of Test cricket and 44 during the past 40 years. The current century has had 27 such occurrences. Food for thought indeed.
The second table lists the ten Test innings which had HWV values above 8.10: in these innings the first eight or nine wickets fell before the halfway mark was reached and there were redeeming stands for the ninth and tenth wickets. At least one of these Tests has been won because of these partnerships. This time I will cover the top four innings.
| Year | Inns | BatTeam | BowTeam | Score | Wkts | HalfScore | Winner | ||
|---|---|---|---|---|---|---|---|---|---|
| 2090 | 2013 | 2 | AUS | Eng | 280 | 10 | 140 | 9.14 | Eng |
| 2016 | 2011 | 3 | AUS | Saf | 47 | 10 | 24 | 9.12 | Saf |
| 52 | 1896 | 4 | AUS | Eng | 44 | 10 | 22 | 8.50 | Eng |
| 327 | 1950 | 4 | ENG | Aus | 122 | 10 | 61 | 8.48 | Aus |
| 623 | 1967 | 3 | PAK | Eng | 255 | 10 | 128 | 8.33 | Eng |
| 866 | 1979 | 1 | IND | Pak | 162 | 10 | 81 | 8.25 | Draw |
| 909 | 1981 | 2 | PAK | Aus | 62 | 10 | 31 | 8.16 | Aus |
| 66 | 1902 | 3 | AUS | Eng | 353 | 10 | 177 | 8.15 | Aus |
| 964 | 1983 | 2 | IND | Win | 207 | 10 | 104 | 8.12 | Win |
| 2210 | 2016 | 1 | ZIM | Nzl | 164 | 10 | 82 | 8.12 | Nzl |
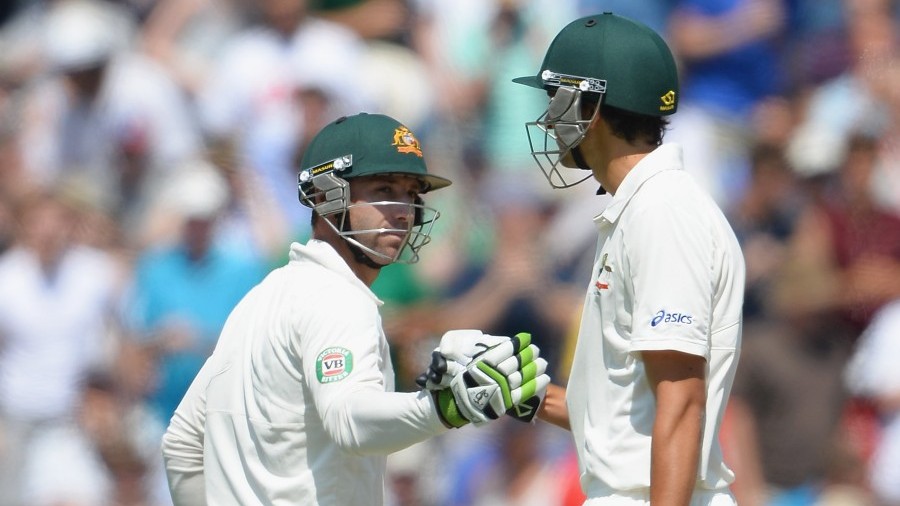
The first Test is of recent vintage. During the 2013 Ashes campaign, Australia dismissed England for 215 at Trent Bridge. But they could not cope with the blistering pace attack led by James Anderson and slumped to 117 for 9. At this point, the debutant with the fancy name, Ashton Agar, walked in to partner the much-loved-and-missed Phillip Hughes. What followed was "Twilight Zone". These two added 163, out of which Agar scored 98. Since the halfway score was reached after the start of the ninth wicket partnership, the HWV is 9.14. England won a thriller, in spite of another feisty last-wicket partnership by Australia of 65 runs in the second innings.
The other innings with HWV exceeding 9.0 would certainly be embedded in everyone's memory. South Africa floundered to 96 in response to Australia's seemingly imposing total of 284. What followed was carnage. Australia collapsed to 21 for 9, against deadly bowling from Vernon Philander, Dale Steyn and Morne Morkel. Would Australia displace New Zealand from the "pedestal"? Getting a further six runs looked quite impossible. But Peter Siddle and Nathan Lyon scored those runs and more. They put on 26 runs for the last wicket. Australia reached a respectable (?) score of 47. That the last innings was a walk in the park for Graeme Smith and Hashim Amla is another story. The HWV for this remarkable innings is 9.11.
For the third featured Test we have to go back well over 120 years. During the Ashes tour of 1896 at The Oval, England scored a poor 145. Australia fared even worse, scoring 119. England went down further, reaching only 84 but setting a seemingly imposing target of 111. Bobby Peel and Jack Hearne ran through Australia and reduced them to 19 for 8 and 25 for 9. The final score of 44 meant that, for the halfway mark of 22, the HWV was 8.50.
How can I not feature the next Test, one of the strangest in Test history? During the Ashes series of 1950, The Gabba turned into a gluepot on the third day after Australia scored 228 on the opening day. Freddie Brown and Lindsay Hassett traded strategic declarations, at 68 for 7 and 32 for 7 respectively. England was left a target of 193. They could not fathom Jack Iverson and slumped to 46 for 8, finally reaching 122. The halfway mark of 61 was reached at a HWV of 8.48. Unlike the table with low HWVs, this table has representation across the ages, indicating that recoveries through ninth and tenth wicket partnerships have been there through the years.
The third table summarizes the HWV averages during the eight designated periods. This will let us know whether there is any clear derivation which is possible on how the HWV values have changed across the years.
| Inns | HWV-Low | HWV-High | ||
|---|---|---|---|---|
| 1877-1914 | 401 | 4.17 | 0.80 | 8.50 |
| 1920-1939 | 320 | 3.90 | 0.79 | 8.08 |
| 1946-1959 | 498 | 3.92 | 0.68 | 8.48 |
| 1960-1969 | 455 | 4.01 | 0.83 | 8.33 |
| 1970-1979 | 477 | 4.04 | 0.73 | 8.25 |
| 1980-1989 | 601 | 4.17 | 0.91 | 8.16 |
| 1990-1999 | 850 | 4.12 | 0.66 | 8.08 |
| 2000-2008 | 1051 | 4.07 | 0.72 | 7.92 |
| 2009-2017 | 907 | 4.22 | 0.77 | 9.14 |
| ..... | ||||
| All Tests | 5560 | 4.09 | 0.66 | 9.14 |
I must admit I am a little surprised at the Mean value of HWV, which is 4.09. My instinct told me that, because of the quality of top-order batsmen, I would find the mean around 3.5 mark. However, the mean is slightly above 4.0. This means that, on an average, across 140 years of Test cricket, the top four wickets contribute around half the final scores. Intriguingly the Median is 4.06, almost exactly equal to the Mean value. This indicates a very balanced distribution indeed.
I am always amazed at the way, taken across a number of Tests, the numbers group into predictable patterns. The mean HWV, across 140 years of Test cricket, is 4.09. Across the different time periods, the lowest mean is 3.90, during the post-war years, only 5.5% off the mean. The highest mean is 4.22, during the most recent 8 years, which is only 3.4% more. This clearly proves that, absorbing the many changes of techniques, law changes, equipment, pitches, strategies et al, the game has virtually remained the same. It is equally important to note that each period has low values below 1.00 and high values exceeding 8.0 (barring one high of 7.92).
Let us now have a look at the distribution of innings by HWV values.

I cannot but repeat that it is fascinating to see how numbers perform as expected, as long as we take a sizable sample. When we look at the above graph we cannot fail to be astounded at the almost perfect distribution of the number of occurrences between the groupings "0.0 - 0.99" and "7.0 - 7.99". These are virtually mirror image values, either side of the two middle, almost matching, groups.
I am sure many readers would like to ask me, "If the halfway score wicket value is so useful, why would you not do a one-third and two-third splits and derive two TxWVs?". A very valid and relevant query indeed. The derivations of such dual indices can give us much better insights into the progress of the innings, especially how the top-order, the middle-order and the lower-order fared. I have done the work and spent some time with the numbers. It is indeed a fascinating experience. However, it is not possible for me to cover that set of measures in this article. So, for the time being, let me be content to open the door for the Halfway wicket index. Maybe one day in future I will do an article on that also.
I would like to inform the readers that there will not be any more articles by me for a few months. Whether I resume or not is something which is up in the air. It is difficult to say anything now. Let us wait and see.
Over the past nine years, I have written over 200 articles for ESPNcricinfo. First, my sincere thanks to ESPNcricinfo in general and Rajesh and Sambit Bal, in particular. They gave the opportunity and encouraged me all these years. And my heart-felt expressions of thanks to all the readers who have contributed many great ideas and have made me a much better cricket analyst. Whatever I have achieved in cricket analysis is due to the wonderful set of readers around the world I have acquired. Come what may, I will strive to keep in touch with all of you.
Anantha Narayanan has written for ESPNcricinfo and CastrolCricket and worked with a number of companies on their cricket performance ratings-related systems