Coming back to win from hopeless first-innings situations
A look at some of the most thrilling victorious fightbacks in Tests
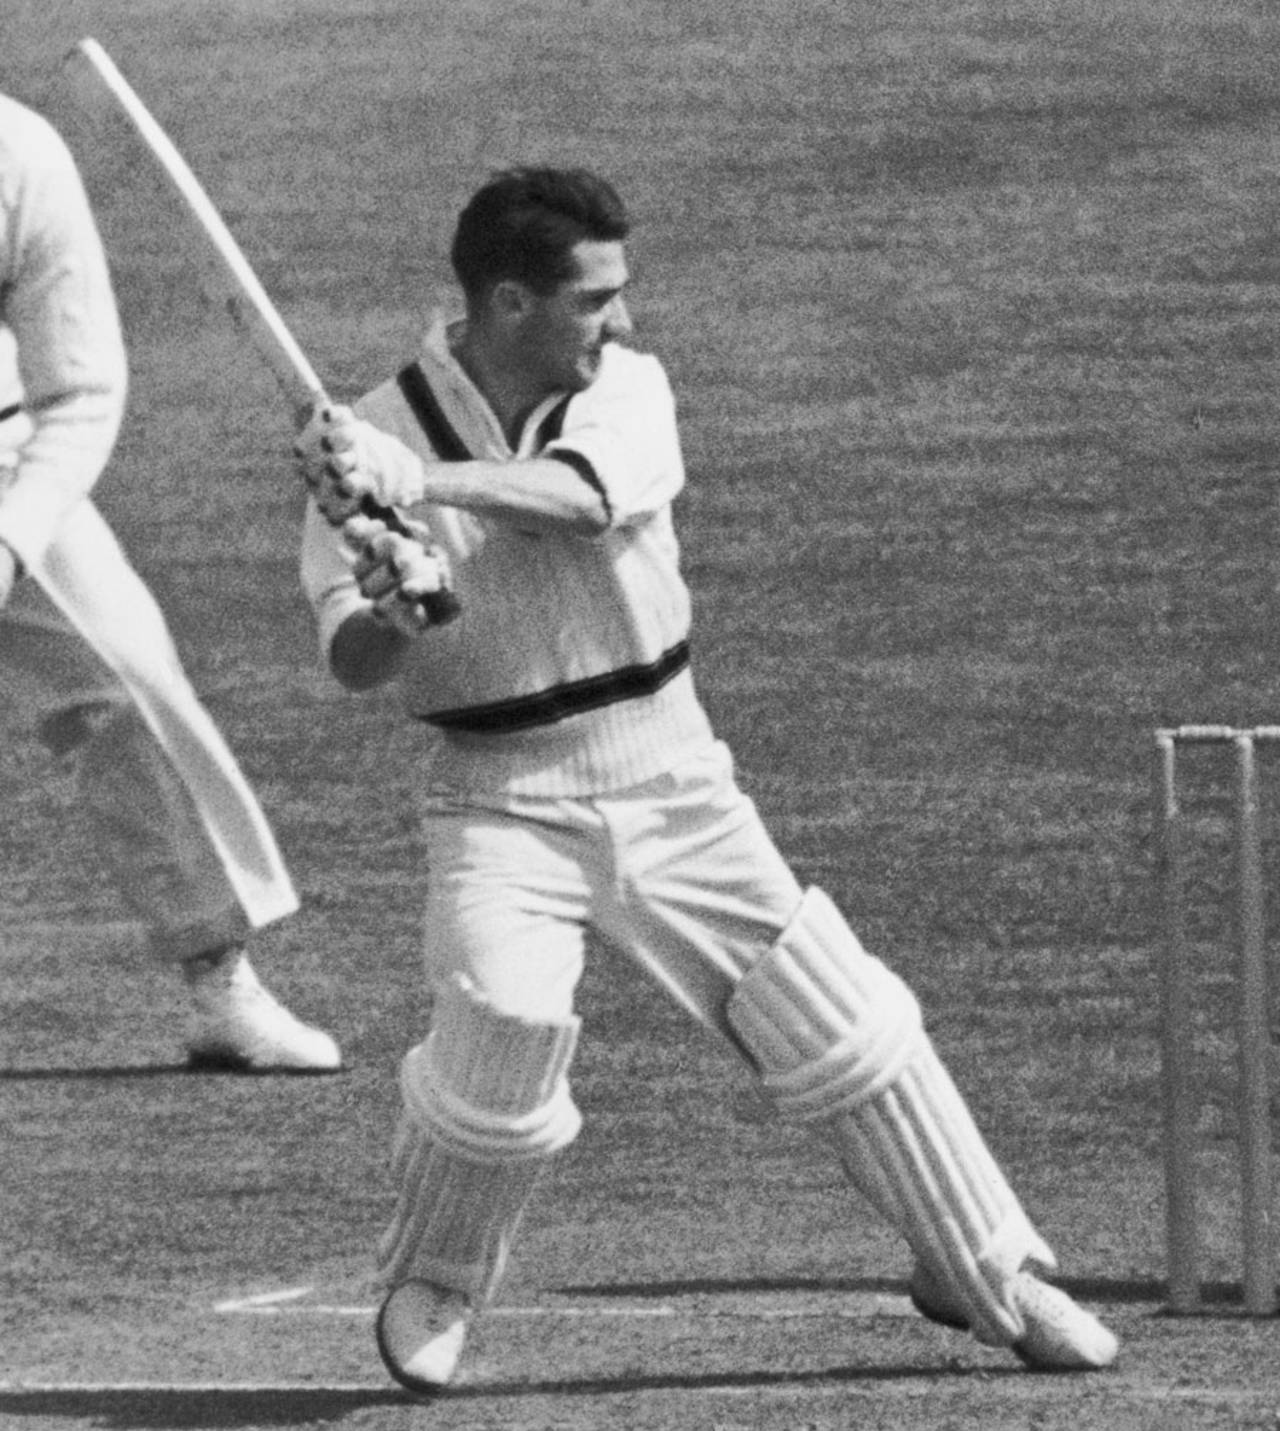
Neil Harvey helped Australia to a famous win at Kingsmead with arguably the finest fourth-innings knock in Tests • Getty Images
Sri Lanka: 257 all out. England: 191/1 and 278/2. What are we looking at? The consensus is that England would get a lead of around 400-plus runs and win the match comfortably. We all know what happened. Despite England's fightback on the last day and last hour, Sri Lanka essayed one of their greatest wins. Where does this match stand in the echelons of coming-from-behind wins? Is it better than Australia's Kingsmead win (1950) or England's win at Headingley (1981) or India's Calcutta miracle (2001) or Australia's win at the SCG (2010) et al?
Suddenly I notice an opportunity to pen an anecdotal article, a nice change from the recent heavy analyses. But this cannot be done by memory and recall. I, for that matter anyone, would certainly forget some important match or other. I have to back up my selections with some sound analysis. Hence this easy-to-read article on the greatest coming-from-behind wins in Test matches.
When I started doing this, I understood that Test cricket is so nuanced that each innings, from second onwards, has its own set of parameters to be considered. The dynamics vary so much that each innings must be evaluated independently.
Let us first get the first innings out of the way. Nothing can be deduced during and after the first innings. A dismissal for 45 does not mean the end of the world, nor does a score of 445 indicate everything is hunky dory. Incidentally, the former match was won and the latter was lost. After all there have been 28 Tests in which sub-150 first innings have been matched by sub-150 scores and 33 matches in which 500-plus scores have been matched by 500-plus scores.
The third innings is radically different to the second innings. The situation faced by New Zealand during the Wellington Test this year is quite different to the situation faced by Sri Lanka against England at Headingley recently and the situation faced by Australia against South Africa at Kingsmead during 1950. So the third and fourth innings will be covered in a later article.
The second innings is very relevant. At the end of the second innings the match is at or past the halfway stage and the match situation becomes clear. At any time during the second innings, the situation for either team could vary significantly and we should look at the match status in an objective form. Hence I developed the MSI (Match Situation Index) before or after the fall of a wicket and see whether the poorly placed teams go on to win.
There are two types of situations in the second-innings analysis. The first is similar to the Headingley Test. The first batting team gets out for a low-to-middling score and the second batting team is looking at a massive first-innings lead. Miracles happen and the first batting team, through the combined efforts of its bowlers and batsmen, wins. The other is similar to the 1950 Kingsmead Test. The second batting team is batting poorly and is looking at a huge deficit. This deficit might even be conceded but the second batting team goes on to win. These have to be looked at separately. First let us look at wins by teams batting first.
Wins by teams batting first
When we look at the MSI in these cases, there is a subtle but important point to be taken care of. At Headingley, England lost the second wicket at 191. But the situation was much worse for Sri Lanka when England was at 191 for 1 (just before the wicket-ball was bowled) than at the fall of the second wicket. Hence here the situation is evaluated before the delivery of the ball which resulted in the wicket.
The other practical point that is to be taken care of is the projection. I use the "resource utilised" at the fall of each wicket, a measure jointly developed by Milind and me by studying the fall of wickets in all 2100 matches. At the fall of the first wicket this stands at 0.121. Thus a score of 125 for 1 will lead to a projection of over 1000 runs, which is capped to get practical scores. In these cases of highly unlikely projections, I tweak the projection by guesstimating a declaration scenario with a maximum lead of 500 runs, duly adjusted by wickets available. This is common-sense-based approach.
The MSI determination is simple. It is determined by the following formula.
                First_Inns_Score
100 x -----------------------------------------
      First_Inns_Score + Second_Inns_Projection
The reason why I have used the team scores, rather than the deficit, to determine the MSI is to differentiate between the two cases presented below. A score of 250 is responded with 50 in the first match. The second is one in which a score of 450 is countered with 250. The lead is 200 in both cases. The 200 deficit in the former Test is a much bigger mountain to climb, because of the team's own low score of 50, than the 200 deficit in the latter Test. In the current method, the trailing team in the former Test will have an MSI of 16.7% and the team in the latter Test, an MSI of 28.6%: a fairly accurate depiction of the match situations.
Given below are two examples from the Headingley Test, one with the possible declaration scenario and the other with an all-out scenario.
Facing the Sri Lankan total of 257, England lost the third wicket at 278. Just before this delivery was bowled, England were at 278 for 2. This translates to a theoretical projection of over 1000(278/0.248). Hence it is projected that there would be a declaration with a lead of 400 (based on a maximum lead, adjusted by the wickets available). So the MSI for Sri Lanka is 257/(257+657), which works out to 28.1%. Quite strongly in favour of England, but not as desperate a situation as one with 20% MSI.
When England were at 344 for 7, about to lose the eighth wicket, the situation had changed considerably. The projection is only 344/0.833, which works to 412. This is retained since it is a very realistic projection and the MSI works to 38.4%, which is a considerable improvement over earlier MSI values. The lowest MSI value for Sri Lanka was 26.7% when England was lording it over at 191 for 1. At the end of the innings, the MSI had improved to 41.3%.
But I can now reveal that this was nowhere near the desperate situation I initially thought it would be. There are many other match situations with much lower first-innings scores that have MSI values well below 20%. The SCG classic win, inspired by Michael Hussey, was resurrected by Australia from a much worse situation. It must be remembered that a really low first-innings score also indicates a sub-par pitch and any 100-plus lead would be almost insurmountable. Hence scores of around 250 in the first innings, on normal pitches, are not bad.
Let us now look at the table and then move on to the summarised potted scores of the Tests. Needless to say, in one match, the team could have low MSI values more than once but the worst situation is selected.
| MtId | Year | FBTeam | FBScore | SBTeam | SBScore | ResUtilized | Projection | MSI | |
|---|---|---|---|---|---|---|---|---|---|
| 25 | 1887 | Eng (won) | 45 | Aus | 64 for 2 | 0.248 | 258 | 14.9% | |
| 1945 | 2010 | Aus (won) | 127 | Pak | 109 for 0 | 0.121 | 627* | 16.8% | |
| 169 | 1928 | Eng (won) | 133 | Saf | 72 for 1 | 0.121 | 583* | 18.6% | |
| 100 | 1908 | Aus (won) | 137 | Eng | 135 for 1 | 0.121 | 587* | 18.9% | |
| 36 | 1892 | Aus (won) | 144 | Eng | 79 for 1 | 0.121 | 594* | 19.5% | |
| 1073 | 1987 | Pak (won) | 116 | Ind | 56 for 1 | 0.121 | 462 | 20.1% | |
| 483 | 1959 | Ind (won) | 152 | Aus | 149 for 2 | 0.248 | 600 | 20.2% | |
| 840 | 1979 | Eng (won) | 152 | Aus | 126 for 1 | 0.121 | 602* | 20.2% | |
| 659 | 1969 | Ind (won) | 156 | Nzl | 78 for 1 | 0.121 | 606* | 20.5% | |
| 1055 | 1986 | Pak (won) | 159 | Win | 103 for 1 | 0.121 | 609* | 20.7% |
* indicates that an adjusted projection has been done based on an estimated lead and possible declaration.
The first Test featured here was a low-scoring one in which the very low MSI of 14.9% is primarily due to the very low first innings of 45. The next one is still vividly in memory. It is known for the Mike Hussey masterpiece. Barring this one, almost all are from 1990 and earlier. Of special interest to the subcontinent is the one in the sixth place. That is Sunil Gavaskar's last Test, featuring the famous all-time classic innings of 96. Pakistan won a similar Test against West Indies a few days later.
Let us now see the potted scores of the featured. Since the MSI situation is clearly depicted, I will only give a brief summary of the match.
Test #25. Australia vs England.
On 28,29,31 January 1887 at Sydney Cricket Ground.
Eng:  45 all out (won by 13 runs)
Aus: 119 all out  (at 64/2, MSI of Eng was 14.9%)
Eng: 184 all out    Aus:  97 all out
There was no notable batting performance in the low-scoring Test. Billy Barnes secured England's narrow win with last-innings figures of 6 for 28.
Test #1945. Australia vs Pakistan.
On 3,4,5,6 January 2010 at Sydney Cricket Ground.
Aus: 127 all out (won by 36 runs)
Pak: 333 all out (at 109/0, MSI of Aus was 16.8%)
Aus: 381 all out    Pak: 139 all out
Who can forget this recent classic fightback by Australia? Facing a poor Australian total of 127, Pakistan were comfortably placed right through their innings and finished with a lead of 206. Then Australia, inspired by one of the best innings played at the SCG, by Hussey, set Pakistan 176 to win. Nathan Hauritz and Mitchell Johnson spearheaded a memorable victory for Australia.
Test #169. South Africa vs England.
On 31 Dec 1927,2,3,4 Jan 1928 at Newlands, Cape Town.
Eng: 133 all out (won by 87 runs)
Saf: 250 all out (at 72/1, MSI of Eng was 18.6%)
Eng: 428 all out    Saf: 224 all out
After conceding a sizable lead of 117, England batted purposefully with the top three batsmen exceeding 85 runs. Bob Wyatt chipped in with 91 and the task of over 300 proved too much for the home team. The wickets were shared.
Test #100. Australia vs England.
On 21,22,24,25,26,27 Feb 1908 at Sydney Cricket Ground.
Aus: 137 all out (won by 49 runs)
Eng: 281 all out (at 135/1, MSI of Aus was 18.9%)
Aus: 422 all out   Eng: 229 all out
This match is an almost perfect replica of the previously referred one. The same description would hold good. The batting hero was the great Victor Trumper, with the famous 166, and the bowling kingpin was Jack Saunders, with 5 for 82.
Test #36. Australia vs England.
On 29,30 Jan, 1,2,3 Feb 1892 at Sydney Cricket Ground.
Aus: 144 all out (won by 72 runs)
Eng: 307 all out (at 79/1, MSI of Aus was 19.5%)
Aus: 391 all out    Eng: 156 all out
This match also followed a similar pattern. A big first-innings lead of over 150 was nullified by Alec Bannerman's 91 and John Lyons' 134. George Giffen and Charlie Turner were unplayable on the last day.
Test #1073. India vs Pakistan.
On 13,14,15,17 Mar 1987 at Chinnaswamy Stadium, Bangalore.
Pak: 116 all out (won by 16 runs)
Ind: 145 all out (at 56/1, MSI of Pak was 20.1%)
Pak: 249 all out    Ind: 204 all out
We came back to recent times with this match. Maninder Singh destroyed Pakistan with a spell of 7 for 27. Then India collapsed from 56 for 1 to 145. Pakistan set India a fair target with almost all batsmen contributing. Then came the greatest swan song of all times. Gavaskar's farewell innings of 96 was not enough to prevent Pakistan winning narrowly. Shades of the Chennai Test a few years later. Iqbal Qasim and Tauseef Ahmed shared almost all the Indian wickets.
Test #483. India vs Australia.
On 19,20,21,23,24 December 1959 at Green Park, Kanpur.
Ind: 152 all out (won by 119 runs)
Aus: 219 all out (at 149/2, MSI of Ind was 20.2%)
Ind: 291 all out
Aus: 105 all out
A very famous Indian win, orchestrated by Jasubhai Patel's 14 wickets in the match. Nari Contractor, Ramnath Kenny and Bapu Nadkarni helped India reach a good total in the third innings. Then Patel and Polly Umrigar destroyed Australia for 105. One could say that with this win Indian cricket came of age.
Test #840. Australia vs England.
On 6,7,8,10,11 January 1979 at Sydney Cricket Ground.
Eng: 152 all out (won by 93 runs)
Aus: 294 all out (at 126/1, MSI of Eng was 20.2%)
Eng: 346 all out    Aus: 111 all out
England conceded a first-innings lead of nearly 150 runs. Then Derek Randall played one of his two great innings against Australia. His 150 helped England set a fair target. John Emburey and Geoff Miller administered the last rites.
Test #659. India vs New Zealand.
On 25,26,27,28,30 Sep 1969 at Brabourne Stadium, Mumbai.
Ind: 156 all out (won by 60 runs)
Nzl: 229 all out (at 78/1, MSI of Ind was 20.5%)
Ind: 260 all out    Nzl: 127 all out
This match has a lot of similarities with the Kanpur match. India conceded a lead of 70 runs. MAK Pataudi's polished 67 and a clutch of useful scores set New Zealand an easy target, which proved too much for them thanks to the wonderful pair of Bishan Bedi and Erapalli Prasanna.
Test #1055. Pakistan vs West Indies.
On 24,26,27,28,29 Oct 1986 at Iqbal Stadium, Faisalabad.
Pak: 159 all out (won by 186 runs)
Win: 248 all out (at 103/1, MSI of Pak was 20.7%)
Pak: 328 all out    Win:  53 all out
This match followed the, by now routine, scenario of good leads and a substantial third innings. Then the script changed. West Indies were dismissed for 53 by Imran Khan and Abdul Qadir. The unlikely batting line-up for this score: Gordon Greenidge, Desmond Haynes, Richie Richardson, Larry Gomes, Viv Richards and Jeff Dujon.
Wins by teams batting second
The analysis for wins achieved from desperate situations by teams batting second is more clear-cut. The first batting team has posted a good score and the second batting team is in a desperate situation with fall of many wickets. The win is achieved from this situation. It could very well be that this team concedes a huge first-innings lead and wins, or there is a batting recovery in this innings itself.
The calculations in this case are simpler. The projection works straightaway and there is no estimate of leads and declarations. The MSI formula is the same. Also the situation is analysed in this segment, immediately after the fall of the wicket. The MSI determination is simple. It is determined by the following formula.
                Second_Inns_Projection
100 x -----------------------------------------
      First_Inns_Score + Second_Inns_Projection
For example I will take a recent famous coming-from-behind win by England at Edgbaston against New Zealand in 1999. New Zealand posted a below-par score of 226 in the first innings. England went to pieces and slumped to 45 for 7. The projection at this point was a very low 53 (45/0.833). The MSI was an equally low 19.0% (53/(53+226)). They recovered a little and despite a first-innings deficit of 100 went on to win the Test easily.
Now a look at the table, followed by the potted scores.
| MtId | Year | FBTeam | FBScore | SBTeam | SBScore | ResUtilized | Projection | MSI | |
|---|---|---|---|---|---|---|---|---|---|
| 320 | 1950 | Saf | 311 | Aus (won) | 46 for 7 | 0.833 | 55 | 15.0% | |
| 1455 | 1999 | Nzl | 226 | Eng (won) | 40 for 6 | 0.747 | 53 | 19.0% | |
| 1453 | 1999 | Aus | 490 | Win (won) | 64 for 4 | 0.517 | 123 | 20.1% | |
| 1535 | 2001 | Aus | 445 | Ind (win) | 97 for 7 | 0.833 | 116 | 20.7% | |
| 1503 | 2000 | Win | 267 | Eng (won) | 37 for 4 | 0.517 | 71 | 21.0% | |
| 1797 | 2006 | Bng | 427 | Aus (won) | 61 for 4 | 0.517 | 117 | 21.5% | |
| 88 | 1906 | Eng | 184 | Saf (won) | 44 for 7 | 0.833 | 52 | 22.0% | |
| 68 | 1902 | Eng | 317 | Aus (won) | 48 for 4 | 0.517 | 92 | 22.5% | |
| 1673 | 2003 | Aus | 556 | Ind (won) | 85 for 4 | 0.517 | 164 | 22.8% | |
| 2016 | 2011 | Aus | 284 | Saf (won) | 83 for 9 | 0.957 | 86 | 23.2% |
As expected, the Test #320 leads by a country mile. Australia's MSI was a measly 15% at 47 for 6. It is of interest to note that barring the first two wickets, Australia's MSI was always below 20%. The next two Tests are of recent vintage. The famous Kolkata 2001 Test and the Bridgetown classic are featured next. There is even a match featuring Australia and Bangladesh. Interestingly it was Australia who were in dire straits. The recent Newlands masterpiece (remember Australia 21 for 9?) rounds off the ten exhilarating Tests.
Since one very famous win is missing from this top-ten featured list, let me give the numbers for that. This was the 1981 Headingley classic. Leaving the third innings out, England's worst situation was when they were 87 for 5, facing 401. This leads to a projection of 136. The MSI works out to 25.3%, clearly outside the top ten. This also illustrates that MSI values below 20% are exceptional.
Test #320. South Africa vs Australia.
On 20,21,23,24 January 1950 at Kingsmead, Durban.
Saf: 311 all out
Aus:  75 all out (won by 5 wickets)
  (at 46/7, Aus had a low MSI of 15.0%)
Saf:  99 all out    Aus: 336 for 5 wkt(s)
Most people only talk of Kolkata and Headingley. This Test, played over 60 years earlier, should be an eye-opener for all. Look at the score. Saf:311, Aus:46/7. The MSI was at an all-time low 15%. Australia kept sliding and were eventually dismissed for 75. A deficit of 235. The situation must have looked like climbing the Table Mountain blind-folded, for Australia. Then the Johnson-Johnston pair went to town and dismissed South Africa for 99. It was still very much South Africa's game. Neil Harvey essayed one of the finest fourth-innings efforts ever and his 151* took Australia to a memorable win. Pushed against the wall, I would put this as the greatest comeback win ever.
Test #1455. England vs New Zealand.
On 1,2,3 July 1999 at Edgbaston, Birmingham.
Nzl: 226 all out
Eng: 126 all out (won by 7 wickets)
  (at 40/6, Eng had a low MSI of 19.0%)
Nzl: 107 all out    Eng: 211 for 3 wkt(s)
Forty-five for 7 against 226 must have looked like curtains for England. They limped to 126. Then Andy Caddick and Alan Mullaly dismissed New Zealand for 107. England won quite comfortably thanks to an amazing contribution from their nightwatchman, Alex Tudor. He added an unbeaten 99 to his first innings effort of 32*.
Test #1453. West Indies vs Australia.
On 26,27,28,29,30 Mar 1999 at Kensington Oval, Bridgetown.
Aus: 490 all out
Win: 329 all out (won by 1 wicket)
  (at 64/4, Win had a low MSI of 20.1%)
Aus: 146 all out    Win: 311 for 9 wkt(s)
This was similar to the Kingsmead Test, although the scores were higher. But the talk here is not on Brian Lara's fourth-innings masterpiece. We should not forget that West Indies were struggling at 64 for 4 in response to 490. The MSI was a low 20.1%. They recovered to post a good total and then Courtney Walsh, with the ball and Lara, with the bat, rewrote history.
Test #1535. India vs Australia.
On 11,12,13,14,15 March 2001 at Eden Gardens, Kolkata.
Aus: 445 all out
India       : 171 all out (won by 171 runs)
  (at 97/7, Ind had a low MSI of 20.7%)
Ind: 657 for 7 wkt(s)    Aus: 212 all out
Everyone talks about VVS Laxman's 281, Rahul Dravid's 180 and Harbhajan Singh's bowling. They tend to forget that India were deep down in the dumps at 97 for 7, 113 for 8 and 129 for 9 in the first innings, in response to 445. They recovered mainly through Laxman's wonderful 59. Steve Waugh enforced follow-on and the rest, as everyone knows, was history.
Test #1503. England vs West Indies.
On 29,30 June, 1 July 2000 at Lord's, London.
Win: 267 all out
Eng: 134 all out (won by 2 wickets)
  (at 37/4, Eng had a low MSI of 21.0%)
Win:  54 all out    Eng: 191 for 8 wkt(s)
West Indies posted a good first-innings total and England were staring at the abyss at 37 for 4. They recovered to reach at least the halfway mark of 134. Then West Indies had one of their inexplicable meltdowns and were all out for 54. They were destroyed by Caddick's 5 for 16. England struggled to reach the target and this was achieved mainly through Dominic Cork's innovative 33. It was an extremely competitive Test.
Test #1797. Bangladesh vs Australia.
On 9,10,11,12,13 Apr 2006 at Narayanganj Stadium, Fatullah.
Bng: 427 all out
Aus: 269 all out (won by 3 wickets)
  (at 61/4, Aus had a low MSI of 21.5%)
Bng: 148 all out    Aus: 307 for 7 wkt(s)
Yes, these scores are true. It was not Bangladesh, but Australia who were in the direst of straits. 61 for 4, 79 for 5 and 93 for 6, in response to 427 must have raised visions of a disastrous loss. Then Adam Gilchrist played arguably his most valuable Test innings and took Australia to a decent score of 269. He scored the 144 out of 208 added while at crease. Then Shane Warne and Jason Gillespie dismissed Bangladesh for 148. Still 307 was a tough target. This time it was Ricky Ponting's turn to take Australia to an unlikely win.
Test #88. South Africa vs England.
On 2,3,4 January 1906 at Old Wanderers, Johannesburg.
Eng: 184 all out
Saf:  91 all out (won by 1 wicket)
  (at 44/7, Saf had a low MSI of 22.0%)
Eng: 190 all out    Saf: 287 for 9 wkt(s)
Forty-four for 7, even against 184, was a very poor situation. South Africa reached only 91. Then dismissed England for a low score. Still 287 looked insurmountable. White scored 81. But the innings of the match was Dave Nourse's unbeaten 93, coming in at No. 8. He added 48 for the last wicket and South Africa won a close match. This innings was very highly ranked in the Wisden 100 tables.
Test #68. Australia vs England.
On 14,15,17,18 February 1902 at Sydney Cricket Ground.
Eng: 317 all out
Aus: 299 all out (won by 7 wickets)
  (at 48/4, Aus had a low MSI of 22.5%)
Eng:  99 all out    Aus: 121 for 3 wkt(s)
The key in this match was the second innings, played by Australia. From 48 for 4, they recovered to 299, thanks to contributions from all six batsmen batting at positions 5 to 10. They conceded a lead of only 18 and the rest of the match followed the usual script. Saunders and Monty Noble bowled unchanged for 48 overs in England's second innings.
Test #1673. Australia vs India.
On 12,13,14,15,16 December 2003 at Adelaide Oval.
Aus: 556 all out
Ind: 523 all out (won by 4 wickets)
  (at 85/4, Ind had a low MSI of 22.8%)
Aus: 196 all out    Ind: 233 for 6 wkt(s)
This is a recent Test match fresh in our memory. Ponting's 242 led Australia to a massive 556, destined to end as the highest losing first-innings ever. India were struggling at 85 for 4 and the MSI was only 22.8%. Then Dravid and Laxman, the Kolkata pair, this time with their roles reversed, added over 300 runs and got the deficit down to 33. Afterwards Ajit Agarkar had his day in the sun and Dravid anchored the Indian fourth innings for a memorable win.
Test #2016. South Africa vs Australia.
On 9,10,11 November 2011 at Newlands, Cape Town.
Aus: 284 all out
Saf:  96 all out (won by 8 wickets)
  (at 83/9, Saf had a low MSI of 23.2%)
Aus:  47 all out    Saf: 236 for 2 wkt(s)
This recent vintage is still plastered in everybody's memory. Eighty-three for 9, in response to 284, was even a follow-on possibility. South Africa was dismissed for 96. Then Vernon Philander bowled like Sydney Barnes and Australia, struggling at 21 for 9, reached 47. Graeme Smith and Hashim Amla helped themselves to a century each to lead South Africa to a comfortable win.
An interesting insight. The worst situation any team faced at the end of the second innings was in match #320. In reply to South Africa's 311, Australia were dismissed for 75. The MSI was a very low 19.4%. That means that the winning chances were lower than one-fifth. Of course this is only for teams that went on to win. In match #153, when England scored 438 and South Africa was dismissed for 30, their MSI was an abysmal 6.4%, the lowest ever, and they went on to lose the match by an innings. As recently as 2012, Zimbabwe's response to New Zealand's 495 was 51 and the MSI was 9.3% and they lost by about four innings and a few runs.
For information and use by interested readers, the resource utilised at the fall of each wicket is 0.121, 0.248, 0.384, 0.517, 0.637, 0.747, 0.833, 0.902, 0.957 and 1.0 respectively. The resource available is "1.0 - resource utilised". It is possible for readers to determine the MSI at any time during the second innings using these values.
We can safely conclude that the greatest comeback win of all time was achieved well over 60 years back. It was orchestrated by an elegant left-hander, one of the best ever. Like Rohan Kanhai in the consistency analysis, Harvey is a batsman who does not enter into any "great" discussions. But on that day at Kingsmead, he played one of the greatest fourth innings ever and took Australia to an extremely unlikely victory.
Let us move forward a few months and on to an imaginary scoreline.
SCG, March 26, 2015. World Cup semi-final. The scores - *********: 300. Australia: 55. Alternately, to have a shorter match, Australia: 54. *********: 55 for 1. This is what happened at Belo Horizonte last evening. In tennis parlance it was like a 0-6, 0-6, 1-6 scoreline in the 2015 Wimbledon semi-final between Andy Murray and another top-ten player. How else can one describe this astonishing match. In the history of the game has there been a better 30 minutes for a team like what Germany had at the beginning of the match. Nine shots on goal and five clinical finishes. And to think that this was the first match for which I stayed up almost all night. It is not often that we see trailing teams praying for the final whistle. What a contrast to the next semi-final?
There are a few cricket matches that come to mind. Only matches involving the top-eight Test teams have been considered.
The first was played during 1938 at The Oval. Eng: 903/7, Aus: 201 & 123.
Sharjah 2002 saw a scoreline of Pak: 59, Aus: 310 & Pak: 53.
Then Paarl during 2012. Saf: 301/8 & Slk: 43.
No less devastating was the 2000 ODI in Sharjah. Slk: 299/8 & Ind: 54.
Finally there was the Newlands T20 match. Slk: 101 & Aus: 102/0/10.2.
Anantha Narayanan has written for ESPNcricinfo and CastrolCricket and worked with a number of companies on their cricket performance ratings-related systems