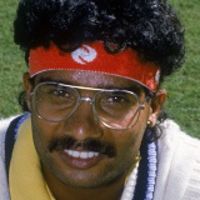
Matches (11)
IPL (2)
RHF Trophy (4)
Pakistan vs New Zealand (1)
WT20 Qualifier (4)
Career Statistics
Tests
Bowling
Statsguru Analysis

Career Averages

SpanMatInnsOversMdnsRunsWktsBBIBBMAvgEconSR5w10w
overview1988-19961728716.21551987668/6116/13630.102.7765.141

vs Team

SpanMatInnsOversMdnsRunsWktsBBIBBMAvgEconSR5w10w
vs England1990-199036212.04158694/1745/22665.112.76141.300
vs New Zealand1988-1995711309.085758326/598/12123.682.4557.920
vs South Africa1996-19962340.0612922/382/3864.503.22120.000
vs Sri Lanka1990-19901120.093411/341/3434.001.70120.000
vs West Indies1988-198947135.214480228/6116/13621.813.5436.921

In Host Country

SpanMatInnsOversMdnsRunsWktsBBIBBMAvgEconSR5w10w
in England1990-199036212.04158694/1745/22665.112.76141.300
in India1988-1996813292.578748458/6116/13616.622.5539.041
in New Zealand1990-199034110.02830963/1434/20951.502.80110.000
in West Indies1989-198935101.3834462/593/9957.333.38101.500

in Continent

SpanMatInnsOversMdnsRunsWktsBBIBBMAvgEconSR5w10w
in Americas1989-198935101.3834462/593/9957.333.38101.500
in Asia1988-1996813292.578748458/6116/13616.622.5539.041
in Europe1990-199036212.04158694/1745/22665.112.76141.300
in Oceania1990-199034110.02830963/1434/20951.502.80110.000

Home vs Away

SpanMatInnsOversMdnsRunsWktsBBIBBMAvgEconSR5w10w
home1988-1996813292.578748458/6116/13616.622.5539.041
away1989-1990915423.3771239214/1745/22659.002.92121.000

By Year

MatInnsOversMdnsRunsWktsBBIBBMAvgEconSR5w10w
year 198848201.553526368/6116/13614.612.6033.631
year 198935101.3834462/593/9957.333.38101.500
year 1990711342.078929164/1745/22658.062.71128.200
year 19951131.0105966/596/599.831.9031.010
year 19962340.0612922/382/3864.503.22120.000

By Season

MatInnsOversMdnsRunsWktsBBIBBMAvgEconSR5w10w
season 1987/881233.56136168/6116/1368.504.0112.621
season 1988/89611269.355734266/598/12128.232.7262.110
season 1989/9034110.02830963/1434/20951.502.80110.000
season 199036212.04158694/1745/22665.112.76141.300
season 1990/911120.093411/341/3434.001.70120.000
season 1995/961131.0105966/596/599.831.9031.010
season 1996/972340.0612922/382/3864.503.22120.000

Captains Involved

SpanMatInnsOversMdnsRunsWktsBBIBBMAvgEconSR5w10w
*M Azharuddin1990-1995812373.088988226/596/5944.902.64101.710
*RJ Shastri1988-19881233.56136168/6116/1368.504.0112.621
*SR Tendulkar1996-19962340.0612922/382/3864.503.22120.000
*DB Vengsarkar1988-1989611269.355734266/598/12128.232.7262.110

Is Captain / Is Not Captain

SpanMatInnsOversMdnsRunsWktsBBIBBMAvgEconSR5w10w
is not captain1988-19961728716.21551987668/6116/13630.102.7765.141

Is Keeper / Is Not Keeper

SpanMatInnsOversMdnsRunsWktsBBIBBMAvgEconSR5w10w
is not keeper1988-19961728716.21551987668/6116/13630.102.7765.141

Toss

SpanMatInnsOversMdnsRunsWktsBBIBBMAvgEconSR5w10w
won the toss1988-19961117444.21071202458/6116/13626.712.7059.241
lost the toss1988-1996611272.048785214/937/17537.382.8877.700

Toss and Batting Sequence

SpanMatInnsOversMdnsRunsWktsBBIBBMAvgEconSR5w10w
won toss & batted1988-1996710272.587636358/6116/13618.172.3346.741
won toss & fielded1989-199047171.320566103/1434/20956.603.30102.900
lost toss & sent in1989-19891234.0113922/832/13969.504.08102.000
lost toss & fielded1988-199659238.047646194/937/17534.002.7175.100

Batting First vs Fielding First

SpanMatInnsOversMdnsRunsWktsBBIBBMAvgEconSR5w10w
matches batting first1988-1996812306.588775378/6116/13620.942.5249.741
matches fielding first1988-1996916409.3671212294/937/17541.792.9584.700

In Team Innings

SpanMatInnsOversMdnsRunsWktsBBIBBMAvgEconSR5w10w
1st team innings1988-19961716419.0821165378/6116/13631.482.7867.921
2nd team innings1988-19961412297.273822298/7516/13628.342.7661.521

In Match Innings

SpanMatInnsOversMdnsRunsWktsBBIBBMAvgEconSR5w10w
1st match innings1988-199699246.334751164/1747/17546.933.0492.400
2nd match innings1988-199687172.348414218/6116/13619.712.4049.221
3rd match innings1988-199699242.060632154/937/17542.132.6196.800
4th match innings1988-19965355.213190148/7516/13613.573.4323.721

Match Result

SpanMatInnsOversMdnsRunsWktsBBIBBMAvgEconSR5w10w
won match1988-199658167.552423328/6116/13613.212.5231.431
lost match1988-1996611236.332716164/937/17544.753.0288.600
drawn match1989-199569312.071848186/596/5947.112.71104.010

Result and Batting Sequence

SpanMatInnsOversMdnsRunsWktsBBIBBMAvgEconSR5w10w
won batting first1988-199646129.540329278/6116/13612.182.5328.831
won fielding first1988-19881238.0129453/435/9418.802.4745.600
lost batting first1989-19891234.0113922/832/13969.504.08102.000
lost fielding first1988-199659202.331577144/937/17541.212.8486.700
drawn batting first1990-199534143.04730786/596/5938.372.14107.210
drawn fielding first1989-199035169.024541104/1745/22654.103.20101.400

In Tournament Type

SpanMatInnsOversMdnsRunsWktsBBIBBMAvgEconSR5w10w
2 team series1988-19961728716.21551987668/6116/13630.102.7765.141

In Match Number per Series

SpanMatInnsOversMdnsRunsWktsBBIBBMAvgEconSR5w10w
only match in series1990-19901120.093411/341/3434.001.70120.000
1st match in series1988-199657175.037477156/598/12131.802.7270.010
2nd match in series1988-199659223.034671144/937/17547.923.0095.500
3rd match in series1988-199559264.369669206/596/5933.452.5279.310
4th match in series1988-19881233.56136168/6116/1368.504.0112.621

In Bowling Position

SpanMatInnsOversMdnsRunsWktsBBIBBMAvgEconSR5w10w
3rd position1988-19881261.02212186/598/12115.121.9845.710
4th position1988-1996712366.0741037204/937/17551.852.83109.800
5th position1988-1996913275.257778388/6116/13620.472.8243.431
6th position1996-19961114.02510---3.64-00