Top-order ducks and inexperience
West Indies have been a pretty ordinary ODI team recently, and the absence of some frontline players - especially bowlers - could hit them hard in the World Cup
Bishen Jeswant
02-Feb-2015
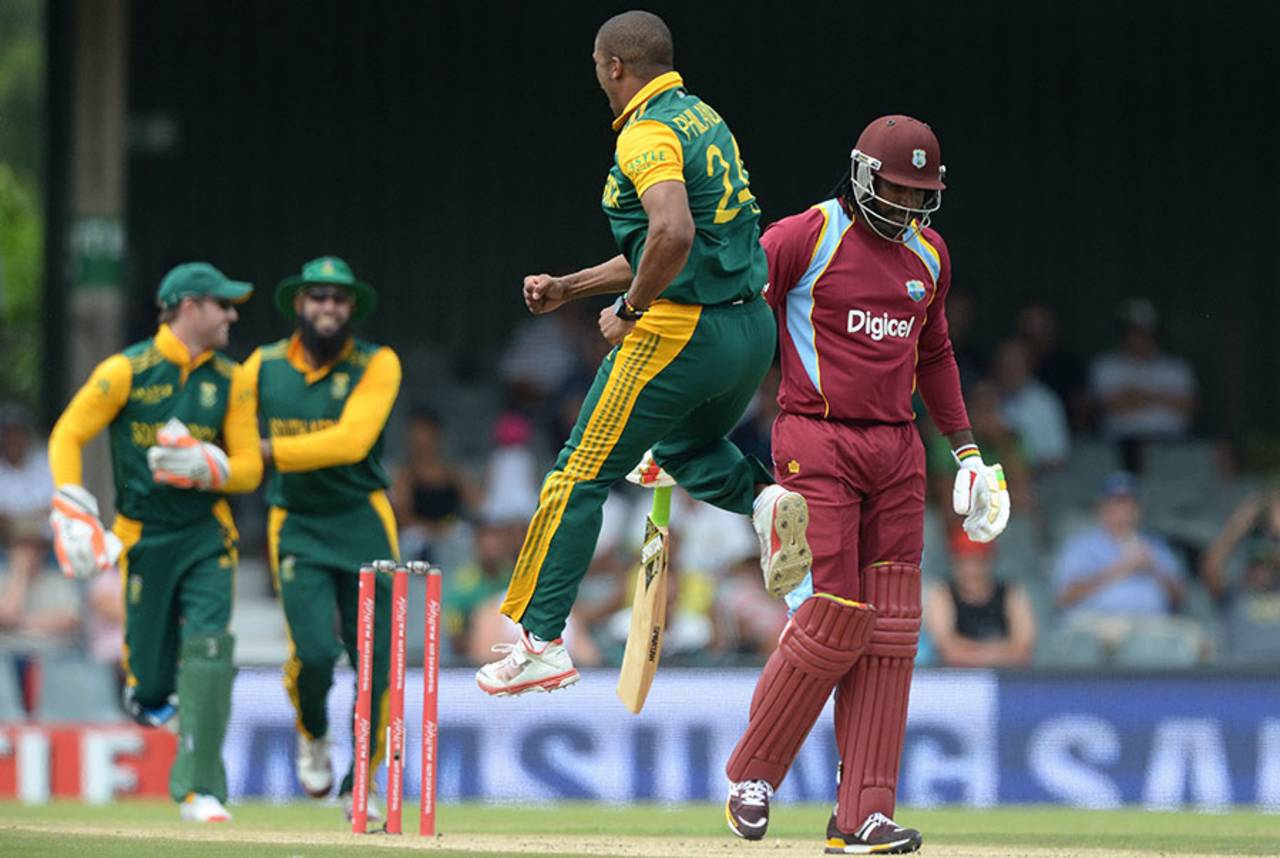
Chris Gayle's batting average of 18.7 since 2013 is the worst for any top-order batsman (Nos. 1 to 7) who has played at least 20 innings • Gallo Images
9 West Indies' frontline batsmen (Nos. 1 to 7) have been scoring a duck every nine innings, on average, since 2013. This is the most frequent rate of scoring ducks for batsmen from Test-playing nations. Bangladesh and Zimbabwe batsmen only score a duck every 11 innings, while Indian and Australian batsmen score one every 18 and 16 innings respectively.
4 West Indies players from the current World Cup squad who have played more than 100 ODIs each: Marlon Samuels (167), Chris Gayle (263), Denesh Ramdin (120) and Darren Sammy (119). Six of the remaining players have played less than 50 ODIs each, with Jonathan Carter and Sheldon Cottrell having played only five and two respectively.
52 Percentage of West Indies' total wickets since 2013 taken by Dwayne Bravo (53), Sunil Narine (36), Ravi Rampaul (27), Tino Best (15) and Kieron Pollard (6). They have taken 137 of 266 wickets taken by West Indies in this period, but none of them are part of the squad for the upcoming World Cup.
45 Marlon Samuels' batting average in 25 ODIs since 2013, the highest for any West Indian batsman. He has also scored three centuries, the most. However, Darren Bravo has scored the most runs (1098), having played nine more ODIs than Samuels.
| Player | Mat | Runs | Ave | SR | 100 | 50 |
| DM Bravo | 34 | 1098 | 35.41 | 73.49 | 2 | 9 |
| MN Samuels | 25 | 946 | 45.04 | 73.05 | 3 | 3 |
| D Ramdin | 26 | 699 | 41.11 | 97.08 | 2 | 3 |
| LMP Simmons | 19 | 633 | 33.31 | 76.08 | 0 | 5 |
| DJG Sammy | 32 | 631 | 30.04 | 97.37 | 0 | 4 |
1 Number of frontline West Indian bowlers in the current squad who have 100-plus wickets; Jerome Taylor, with 106 wickets, is the only one. Chris Gayle has 158 wickets from 263 ODIs bowling his part-time offspin. Among available bowlers, their highest wicket-taker since 2013 is captain Jason Holder with 37 wickets.
| Player | Mat | Wkts | Ave | Econ | SR | 4 |
| JO Holder | 26 | 37 | 30.21 | 5.55 | 32.6 | 2 |
| KAJ Roach | 20 | 24 | 32.70 | 4.78 | 41.0 | 1 |
| DJG Sammy | 32 | 16 | 56.25 | 4.66 | 72.3 | 0 |
| AD Russell | 13 | 14 | 38.35 | 6.31 | 36.4 | 0 |
| NO Miller | 6 | 10 | 24.20 | 4.48 | 32.4 | 1 |
18.7 Chris Gayle's batting average since 2013, the poorest for any frontline batsman (Nos. 1 to 7) who has played at least 20 innings in this period. Each of the other 60 batsmen who have played at least 20 innings in this period average more than 20.
1 Number of times West Indies have made it to the semi-finals in the last seven editions of the World Cup. Every other top-eight nation, except England, has played in at least three semi-finals. England have played in two (1987 and 1992), winning both, but going on to lose both subsequent finals.
16-16 West Indies' win-loss record in the last five World Cups. Every other top-eight nation has won more matches than they have lost.
8 West Indies' bowlers concede a boundary every eight balls, when bowling in the last ten overs of an ODI innings (since 2013). This is the lowest frequency at which bowlers from any Test-nation concedes boundaries at this stage of an ODI. England, Bangladesh and New Zealand concede boundaries most frequently.
28.6 Average opening stand for West Indies since 2013, the second worst for any Test team after New Zealand (21.2). They have eight 50-plus stands in this period, with only New Zealand (5) and Zimbabwe (4) having fewer.
Bishen Jeswant is a stats sub editor at ESPNCricinfo. @bishen_jeswant