Test careers that started and finished strong
An analysis of how well or poorly the leading Test batsmen started and finished their illustrious careers
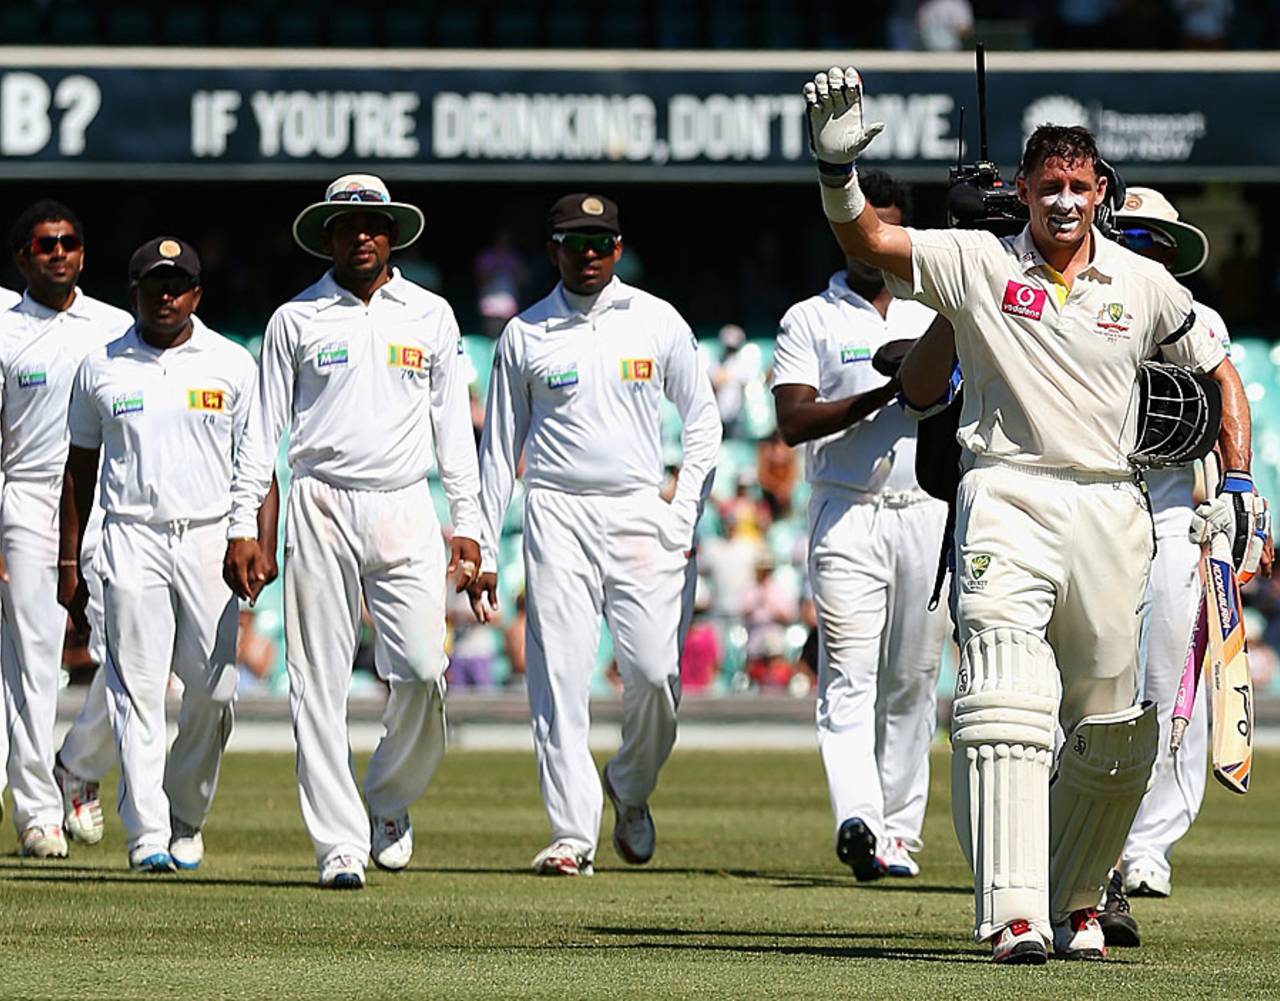
Michael Hussey began and ended his Test career on a high • Getty Images
How they started and how they finished: the batsmen
The idea for this article came to me when Hussey announced his retirement from International cricket towards the end of 2012. I had an instinctive feeling that Michael Hussey had a great start to his career as well as a great end. I thought it was worthwhile looking at the start and end of the careers of all players. And I was almost certain that another player, right at the top of many batting lists, would announce his retirement from Test cricket if he had an ordinary home series against Australia. Well, Sachin Tendulkar had an ordinary series but he did not announce his retirement.
However, I did not want one player's inability to take a call on his fabulous but fading career have an influence on the timing of an important article. Hence, I have done this article knowing fully well that Tendulkar is still on for at least the next series. Let me also say this. Tendulkar's last ten Tests have been played at home and he has scored 367 runs at an average of 24.46. In three away-Tests in the forthcoming Test series against South Africa, facing Dale Steyn, Morne Morkel and Vernon Philander, would he suddenly score 400-500 runs? Even the staunchest of Tendulkar's supporters would realise the futility of such expectations. It is likely that he scores only 200 to 250 runs in these three Tests. So this article might only undergo minor changes.
I am going to standardise the criteria. First, the start of a player's career is defined as the first ten Tests and the finish of his career as the last ten Tests. The cut-off for this analysis is batsmen with 4,000-or-more Test runs and thus, 115 batsmen qualify. Everton Weekes crossed 4,000 comfortably and played 48 Tests, which is the lowest any player has played in this list. So, even he has a middle period of 28 Tests. Because of the rather high cut-off, batsmen like Hanif Mohammad, Dean Jones, Arthur Morris, Tony Greig, Clem Hill et al. do not qualify. But this also means that non-batsmen such as Shane Warne, Chaminda Vaas, Wasim Akram and a host of wicket-keeper-batsmen are also excluded. And, I am very close to the 50-Test cut-off which I was aiming at.
I did not want to filter out players who are still playing Test cricket. That would exclude many players and is an artificial restriction, especially since some of them may play very few Tests in future. I am also going to use the Batting average as the measure of comparison. It is the most used and acceptable of performance measures. Runs-per-Test value implies quantity rather than performance and Runs-per-Innings metric has its own shortcomings especially as we have batsmen who have batted from no.1 to no.8.
I had initially planned to complete both batsmen and bowlers in the same article. Then, as normally happens, I ended with 8 tables and one graph for the batsmen. I did not want to test the ability of cricinfo's production team to handle 16 tables and two graphs in one article. So the article on the bowlers is the next one.
I have incorporated different types of analysis in this article. I have tables which list the best and worst starts to the player's career. I have the best and worst finishes to a player's career. Then I have combined the start and finish to create 4 different combinations. Great starts and great finishes, great starts and poor finishes, poor starts and great finishes and finally poor starts and poor finishes. These are represented in a BCG(Boston Consultancy Group) Chart, which is my favourite graph. Many insights can be drawn from these tables.
First let us look at the great starts. In order to keep the tables to reasonable sizes I have to have cut-offs for each table.
| Batsman | Tests | Runs | Average | Start-Inns | NOs | Runs | Average | Ratio |
|---|---|---|---|---|---|---|---|---|
| RN Harvey | 79 | 6149 | 48.42 | 15 | 4 | 1045 | 95.00 | 196.2% |
| TT Samaraweera | 81 | 5462 | 48.77 | 10 | 3 | 581 | 83.00 | 170.2% |
| MA Taylor | 104 | 7525 | 43.50 | 18 | 1 | 1088 | 64.00 | 147.1% |
| KD Walters | 74 | 5357 | 48.26 | 16 | 3 | 903 | 69.46 | 143.9% |
| AJ Strauss | 100 | 7037 | 40.91 | 20 | 2 | 1055 | 58.61 | 143.3% |
| N Kapil Dev | 131 | 5248 | 31.05 | 14 | 2 | 510 | 42.50 | 136.9% |
| Javed Miandad | 124 | 8832 | 52.57 | 17 | 4 | 917 | 70.54 | 134.2% |
| MEK Hussey | 79 | 6235 | 51.53 | 18 | 4 | 957 | 68.36 | 132.7% |
| H Sutcliffe | 54 | 4555 | 60.73 | 14 | 1 | 1037 | 79.77 | 131.3% |
| IT Botham | 102 | 5200 | 33.55 | 12 | 1 | 479 | 43.55 | 129.8% |
| EdeC Weekes | 48 | 4455 | 58.62 | 15 | 0 | 1125 | 75.00 | 127.9% |
| DL Haynes | 116 | 7487 | 42.30 | 18 | 1 | 918 | 54.00 | 127.7% |
Neil Harvey had the best start that any top cricketer has ever had. He had six hundreds in his first ten Tests and averaged 95.00. That is nearly 200% of his career figure. Thilan Samaraweera had a similar start, achieving over 170% of his career average. Mark Taylor, Doug Walters, Andrew Strauss and Michael Hussey should not surprise anyone. My hunch about Hussey was correct. But look at the starts Kapil Dev and Ian Botham had. They had averages like regular batsmen. Herbert Sutcliffe also had a near-80 average. It is surprising that only Sutcliffe, Javed Miandad and Hussey finished with a 50+ career average while the others dropped off.
| Batsman | Tests | Runs | Average | Start-Inns | NOs | Runs | Average | Ratio |
|---|---|---|---|---|---|---|---|---|
| JH Kallis | 162 | 13128 | 56.10 | 15 | 0 | 340 | 22.67 | 40.4% |
| SR Waugh | 168 | 10927 | 51.06 | 16 | 3 | 271 | 20.85 | 40.8% |
| MS Atapattu | 90 | 5502 | 39.02 | 19 | 0 | 321 | 16.89 | 43.3% |
| MD Crowe | 77 | 5444 | 45.37 | 16 | 0 | 331 | 20.69 | 45.6% |
| HM Amla | 70 | 5785 | 52.12 | 19 | 0 | 455 | 23.95 | 45.9% |
| HH Gibbs | 90 | 6167 | 41.95 | 19 | 0 | 380 | 20.00 | 47.7% |
| DB Vengsarkar | 116 | 6868 | 42.13 | 18 | 1 | 350 | 20.59 | 48.9% |
| ML Hayden | 103 | 8626 | 50.74 | 16 | 0 | 413 | 25.81 | 50.9% |
| GS Sobers | 93 | 8032 | 57.78 | 17 | 3 | 419 | 29.93 | 51.8% |
| DC Boon | 107 | 7422 | 43.66 | 18 | 0 | 431 | 23.94 | 54.8% |
| DL Vettori | 112 | 4516 | 30.11 | 17 | 4 | 230 | 17.69 | 58.8% |
| JL Langer | 105 | 7696 | 45.27 | 15 | 0 | 402 | 26.80 | 59.2% |
This is the other end of the table. Players, who had miserable starts to their careers. I knew about Steve Waugh's very poor start to his Test career, averaging 20.8. However, I could have never imagined that Jacques Kallis, who is currently averaging 56.1, started his career with an average of 22.67, which is around 40%, the same as Waugh's. Marvan Atapattu's starting sequence of 0 0 0 1 0 0 meant that he was going to be a contender for the worst start. It is a miracle that he has been upstaged by Kallis and Waugh. A knock of 149 runs in the 10th Test took care of that. But his average of 16.89 is the lowest by any batsman in this group at the end of the 10th test. It is surprising to see very poor starts by Martin Crowe and Hashim Amla, who currently averages over 52. But here comes the ball-to-Mike Gatting. Look at the awful start of Garry Sobers. A Kris Srikkanth-like 29.93. The amazing feature of this table is that four of these batsmen recovered very well, to post career averages exceeding 50.
| Batsman | Tests | Runs | Average | Finish-Inns | NOs | Runs | Average | Ratio |
|---|---|---|---|---|---|---|---|---|
| S Chanderpaul | 148 | 10830 | 51.82 | 15 | 4 | 1006 | 91.45 | 176.5% |
| SR Waugh | 168 | 10927 | 51.06 | 14 | 4 | 863 | 86.30 | 169.0% |
| G Kirsten | 101 | 7289 | 45.27 | 18 | 3 | 1003 | 66.87 | 147.7% |
| MS Dhoni | 77 | 4209 | 39.71 | 15 | 3 | 700 | 58.33 | 146.9% |
| MJ Clarke | 92 | 7275 | 52.34 | 18 | 2 | 1227 | 76.69 | 146.5% |
| CH Gayle | 97 | 6836 | 42.46 | 17 | 3 | 859 | 61.36 | 144.5% |
| CL Hooper | 102 | 5762 | 36.47 | 15 | 0 | 742 | 49.47 | 135.6% |
| KC Sangakkara | 117 | 10486 | 56.99 | 19 | 4 | 1125 | 75.00 | 131.6% |
| DL Haynes | 116 | 7487 | 42.30 | 17 | 4 | 719 | 55.31 | 130.8% |
| N Kapil Dev | 131 | 5248 | 31.05 | 9 | 2 | 283 | 40.43 | 130.2% |
| RC Fredericks | 59 | 4334 | 42.49 | 20 | 2 | 974 | 54.11 | 127.3% |
These are the great finishers. They retired at the top, so to say. Shivnarine Chanderpaul, MS Dhoni, Michael Clarke, Kumar Sangakkara and Chris Gayle are still active and this value represents what they did in their last ten Tests. The amazing thing is the performance of Steve Waugh. Starting at 40%, he finished at 169%. Gary Kirsten, Carl Hooper, Desmond Haynes and Roy Fredericks all finished right at the top. Kapil Dev who appeared in the first Table has also finished well, though as a batsman. When I do the bowling article he is likely to find himself at the other end of the spectrum. It is safe to say that this finish helped Steve Waugh have a very good average.
| Batsman | Tests | Runs | Average | Finish-Inns | NOs | Runs | Average | Ratio |
|---|---|---|---|---|---|---|---|---|
| IA Healy | 119 | 4356 | 27.40 | 17 | 0 | 138 | 8.12 | 29.6% |
| PD Collingwood | 68 | 4260 | 40.57 | 13 | 0 | 202 | 15.54 | 38.3% |
| Mudassar Nazar | 76 | 4114 | 38.09 | 16 | 0 | 249 | 15.56 | 40.9% |
| AI Kallicharran | 66 | 4399 | 44.43 | 14 | 1 | 253 | 19.46 | 43.8% |
| SR Tendulkar | 198 | 15837 | 53.87 | 16 | 1 | 367 | 24.47 | 45.4% |
| GA Gooch | 118 | 8900 | 42.58 | 19 | 0 | 397 | 20.89 | 49.1% |
| TT Samaraweera | 81 | 5462 | 48.77 | 18 | 0 | 440 | 24.44 | 50.1% |
| KJ Hughes | 70 | 4415 | 37.42 | 19 | 0 | 372 | 19.58 | 52.3% |
| DR Martyn | 67 | 4406 | 46.38 | 18 | 2 | 392 | 24.50 | 52.8% |
| MC Cowdrey | 114 | 7624 | 44.07 | 17 | 0 | 396 | 23.29 | 52.9% |
| ST Jayasuriya | 110 | 6973 | 40.07 | 18 | 0 | 393 | 21.83 | 54.5% |
| DB Vengsarkar | 116 | 6868 | 42.13 | 16 | 0 | 370 | 23.12 | 54.9% |
| MP Vaughan | 82 | 5719 | 41.44 | 17 | 0 | 388 | 22.82 | 55.1% |
| Inzamam-ul-Haq | 120 | 8830 | 49.61 | 18 | 2 | 439 | 27.44 | 55.3% |
| ML Hayden | 103 | 8626 | 50.74 | 18 | 1 | 486 | 28.59 | 56.3% |
| L Hutton | 79 | 6971 | 56.67 | 16 | 0 | 511 | 31.94 | 56.4% |
| GR Viswanath | 91 | 6080 | 41.93 | 15 | 1 | 334 | 23.86 | 56.9% |
| V Sehwag | 104 | 8586 | 49.34 | 17 | 0 | 498 | 29.29 | 59.4% |
| H Sutcliffe | 54 | 4555 | 60.73 | 14 | 1 | 471 | 36.23 | 59.7% |
These batsmen finished very poorly. Ian Healy can be given a miss. Paul Collingwood, Alvin Kallicharran and Mudassar Nazar had nightmare finishes to their careers. But not at the same level as the next entry - Tendulkar. As already mentioned, Tendulkar, in his last 10 Tests, all at home, averaged 24.46. The writing on the wall is big and bright but is unfortunately not seen by many. "He should take the call" is the refrain used by all people, including even the latest entrants to the IPL gravy train. Would any other batsman have survived this level of performance? One really good innings, the fluent and very valuable-81 at Chennai, out of the 16 during the recent past. Graham Gooch also has finished below 50% too. Then a set of quality players have all finished below 60%. The fact that there are 19 players in this sub-60 list indicates that many batsmen stay beyond their sell-by date. And the presence of greats like Tendulkar, Len Hutton, Sutcliffe, Gundappa Viswanath, and Inzamam-ul-Haq in this lot is a matter to ponder over.
Now for the combination analysis. I have considered the two percentage values, start and finish and got them grouped into 4 combination groups. Not all batsmen are covered though. For each combination I have set different criteria and grouped the players. This is to ensure that the graph is not too crowded. The absence of players from these four groups basically means that they are in the circle in the centre. You can have a look at all players by perusing the downloadable file.
To represent these selected players I have used my favourite BCG chart. BCG stands for Boston Consulting Group for whom Bruce Henderson invented this method of depicting growth-share matrix for companies. It has since found many uses and I have used this graph extensively. When there are two independent measures, the quadrant-based representation of BCG chart is an excellent visual method of classifying players. In this case the two independent measures are the first-10-test % and the last-10-test %. These two measures form four groups and lend themselves to an excellent BCG representation.
We have the first-10-tests average percentage in the X-axis and the last-10-tests average % in the Y-axis. The graph is split into four quadrants. The top-right quadrant represents great starts and great finishes. The top-left quadrant represents poor starts and great finishes. The bottom-left quadrant represents poor starts and poor finishes. The bottom-right quadrant represents great starts and poor finishes. Let us now look at the graph.
Since I am going to show the tables for all these classifications I am not going to delve too long on the graph now. Let me highlight a few top players who are presented in the graph. Barring Kapil Dev, the top-right quadrant features many top players including Sunil Gavaskar, Chanderpaul and David Gower. Sutcliffe, Everton Weekes and Miandad are in the bottom-right quadrant. A number of top batsmen including Gooch, Michael Vaughan, Inzamam and Matthew Hayden are in the bottom-left quadrant. The top-left quadrant features Waugh, Sangakkara, Ian Chappell and of course, Kallis.
Now let us move on to the tables containing these group combinations. More players are featured in these tables than the graph.
| Batsman | Tests | Runs | Average | START-Inns | NOs | Runs | Average | % of Career avge | FINISH-Inns | NOs | Runs | Average | % of Career avge |
|---|---|---|---|---|---|---|---|---|---|---|---|---|---|
| S Chanderpaul | 148 | 10830 | 51.82 | 14 | 4 | 618 | 61.80 | 119.3% | 15 | 4 | 1006 | 91.45 | 176.5% |
| MA Taylor | 104 | 7525 | 43.50 | 18 | 1 | 1088 | 64.00 | 147.1% | 19 | 2 | 905 | 53.24 | 122.4% |
| N Kapil Dev | 131 | 5248 | 31.05 | 14 | 2 | 510 | 42.50 | 136.9% | 9 | 2 | 283 | 40.43 | 130.2% |
| DL Haynes | 116 | 7487 | 42.30 | 18 | 1 | 918 | 54.00 | 127.7% | 17 | 4 | 719 | 55.31 | 130.8% |
| JH Edrich | 77 | 5138 | 43.54 | 15 | 2 | 657 | 50.54 | 116.1% | 17 | 2 | 801 | 53.40 | 122.6% |
| MEK Hussey | 79 | 6235 | 51.53 | 18 | 4 | 957 | 68.36 | 132.7% | 18 | 3 | 786 | 52.40 | 101.7% |
| SM Gavaskar | 125 | 10122 | 51.12 | 20 | 4 | 978 | 61.12 | 119.6% | 13 | 0 | 755 | 58.08 | 113.6% |
| DI Gower | 117 | 8231 | 44.25 | 16 | 1 | 763 | 50.87 | 114.9% | 19 | 4 | 776 | 51.73 | 116.9% |
| AB de Villiers | 85 | 6364 | 50.51 | 17 | 1 | 841 | 52.56 | 104.1% | 17 | 2 | 907 | 60.47 | 119.7% |
| CH Lloyd | 110 | 7515 | 46.68 | 18 | 3 | 795 | 53.00 | 113.5% | 14 | 2 | 611 | 50.92 | 109.1% |
| M Azharuddin | 99 | 6215 | 45.04 | 16 | 2 | 711 | 50.79 | 112.8% | 18 | 2 | 739 | 46.19 | 102.6% |
| AN Cook | 90 | 7307 | 49.04 | 18 | 2 | 815 | 50.94 | 103.9% | 19 | 1 | 947 | 52.61 | 107.3% |
This table gives the full details of the combination analysis. The criteria here are that both percentage values should be over 100. Chanderpaul is still active. However a start of 119.3% and a finish (on-going) of 176.5% is magnificent. The player that Chanderpaul is, he is unlikely to suffer a drastic loss of form. Mark Taylor had an equally spectacular start and finish to his career. Kapil Dev is the only non-batsman in this list. Hussey had a wonderful start and a very good finish. Gavaskar, the true professional, knew when to quit, complementing his excellent start. AB de Villiers and Alastair Cook are currently active players who could go off this list if their current form drops. Let us not forget that Chanderpaul, Hussey, Gavaskar and de Villiers have achieved this with career averages of 50+. Chanderpaul averages 48.96 during the middle 128 Tests.
| Batsman | Tests | Runs | Average | START-Inns | NOs | Runs | Average | % of Career avge | FINISH-Inns | NOs | Runs | Average | % of Career avge |
|---|---|---|---|---|---|---|---|---|---|---|---|---|---|
| VVS Laxman | 134 | 8781 | 45.97 | 16 | 2 | 405 | 28.93 | 62.9% | 19 | 2 | 569 | 33.47 | 72.8% |
| RB Kanhai | 79 | 6227 | 47.53 | 19 | 2 | 505 | 29.71 | 62.5% | 16 | 2 | 479 | 34.21 | 72.0% |
| MW Gatting | 79 | 4409 | 35.56 | 18 | 1 | 390 | 22.94 | 64.5% | 19 | 0 | 425 | 22.37 | 62.9% |
| Mohammad Yousuf | 90 | 7530 | 52.29 | 18 | 1 | 588 | 34.59 | 66.1% | 20 | 0 | 636 | 31.80 | 60.8% |
| DC Boon | 107 | 7422 | 43.66 | 18 | 0 | 431 | 23.94 | 54.8% | 15 | 0 | 463 | 30.87 | 70.7% |
| KJ Hughes | 70 | 4415 | 37.42 | 19 | 0 | 513 | 27.00 | 72.2% | 19 | 0 | 372 | 19.58 | 52.3% |
| MP Vaughan | 82 | 5719 | 41.44 | 16 | 0 | 439 | 27.44 | 66.2% | 17 | 0 | 388 | 22.82 | 55.1% |
| Inzamam-ul-Haq | 120 | 8830 | 49.61 | 17 | 2 | 466 | 31.07 | 62.6% | 18 | 2 | 439 | 27.44 | 55.3% |
| GA Gooch | 118 | 8900 | 42.58 | 17 | 2 | 414 | 27.60 | 64.8% | 19 | 0 | 397 | 20.89 | 49.1% |
| HH Gibbs | 90 | 6167 | 41.95 | 19 | 0 | 380 | 20.00 | 47.7% | 17 | 1 | 439 | 27.44 | 65.4% |
| ML Hayden | 103 | 8626 | 50.74 | 16 | 0 | 413 | 25.81 | 50.9% | 18 | 1 | 486 | 28.59 | 56.3% |
| DB Vengsarkar | 116 | 6868 | 42.13 | 18 | 1 | 350 | 20.59 | 48.9% | 16 | 0 | 370 | 23.12 | 54.9% |
| IA Healy | 119 | 4356 | 27.40 | 14 | 0 | 231 | 16.50 | 60.2% | 17 | 0 | 138 | 8.12 | 29.6% |
This is the other end of the table. Batsmen whose starts and finishes were below par. The criterion is that both numbers should be below 75%. There are a number of batsmen in this list. Laxman's drop in form and indifferent start are fresh in our memory. Spare a thought for top class batsmen like Gooch, Hayden and Dilip Vengsarkar who had poor starts and finishes. This double low figures also indicate that the career of these batsmen between the 11th and 11th-last Test has been very good: much better than their career averages. Let me take the striking examples of Hayden and Gooch. Hayden averaged 56.40 during the 83 matches in between and Gooch, 46.22 during the intermediate 98 Tests.
| Batsman | Tests | Runs | Average | START-Inns | NOs | Runs | Average | % of Career avge | FINISH-Inns | NOs | Runs | Average | % of Career avge |
|---|---|---|---|---|---|---|---|---|---|---|---|---|---|
| TT Samaraweera | 81 | 5462 | 48.77 | 10 | 3 | 581 | 83.00 | 170.2% | 18 | 0 | 440 | 24.44 | 50.1% |
| H Sutcliffe | 54 | 4555 | 60.73 | 14 | 1 | 1037 | 79.77 | 131.3% | 14 | 1 | 471 | 36.23 | 59.7% |
| IT Botham | 102 | 5200 | 33.55 | 12 | 1 | 479 | 43.55 | 129.8% | 15 | 2 | 271 | 20.85 | 62.1% |
| Javed Miandad | 124 | 8832 | 52.57 | 17 | 4 | 917 | 70.54 | 134.2% | 17 | 1 | 569 | 35.56 | 67.6% |
| AI Kallicharran | 66 | 4399 | 44.43 | 17 | 2 | 725 | 48.33 | 108.8% | 14 | 1 | 253 | 19.46 | 43.8% |
| EdeC Weekes | 48 | 4455 | 58.62 | 15 | 0 | 1125 | 75.00 | 127.9% | 18 | 1 | 650 | 38.24 | 65.2% |
| MA Atherton | 115 | 7728 | 37.70 | 19 | 0 | 840 | 44.21 | 117.3% | 19 | 0 | 448 | 23.58 | 62.5% |
| V Sehwag | 104 | 8586 | 49.34 | 13 | 0 | 693 | 53.31 | 108.0% | 17 | 0 | 498 | 29.29 | 59.4% |
These batsmen had a wonderful start but finished very poorly. The criteria are that they should have started at over 105% and finished at below 75%. Not many qualify. Samaraweera had the biggest difference between the start and finish, a huge 120%. Sutcliffe, Miandad and Weekes had substantial drops. Virender Sehwag's recent travails are reflected in this table. He averages at only 60% of his career. His return back to the Test team is uncertain. More so since he is not the one to decide when he should quit. He is under the selectorial hammer. Kallicharran probably had the worst end to his career.
| Batsman | Tests | Runs | Average | START-Inns | NOs | Runs | Average | % of Career avge | FINISH-Inns | NOs | Runs | Average | % of Career avge |
|---|---|---|---|---|---|---|---|---|---|---|---|---|---|
| SR Waugh | 168 | 10927 | 51.06 | 16 | 3 | 271 | 20.85 | 40.8% | 14 | 4 | 863 | 86.30 | 169.0% |
| G Kirsten | 101 | 7289 | 45.27 | 18 | 0 | 568 | 31.56 | 69.7% | 18 | 3 | 1003 | 66.87 | 147.7% |
| HM Amla | 70 | 5785 | 52.12 | 19 | 0 | 455 | 23.95 | 45.9% | 17 | 1 | 1010 | 63.12 | 121.1% |
| RC Fredericks | 59 | 4334 | 42.49 | 19 | 0 | 525 | 27.63 | 65.0% | 20 | 2 | 974 | 54.11 | 127.3% |
| KC Sangakkara | 117 | 10486 | 56.99 | 17 | 1 | 638 | 39.88 | 70.0% | 19 | 4 | 1125 | 75.00 | 131.6% |
| JG Wright | 82 | 5334 | 37.83 | 18 | 0 | 438 | 24.33 | 64.3% | 20 | 1 | 854 | 44.95 | 118.8% |
| IM Chappell | 75 | 5345 | 42.42 | 16 | 1 | 409 | 27.27 | 64.3% | 19 | 3 | 799 | 49.94 | 117.7% |
These batsmen had a nightmare start and a fairy-tale finish. Steve Waugh: what can one say! He has one of the worst starts any player would have had, averaging just over 20 and finishes with an average of 86.3. This is the perfect example of quitting at the top. Generally Indians talk of Gavaskar's timing of his departure. But he averaged only 58 in the last 10 Tests. Look at Steve Waugh. Amla and Sangakkara are active players and their figures are bound to change. Look at the way Gary Kirsten and Ian Chappell ended their careers. At least Chappell is here because of his low career average. But Kirsten averaged almost 67 at the end.
Some readers might query that quite a few top players have not found a mention in this analysis. The point is that this article is about exceptions, on either side and in combination. Quite a few players are somewhere in the middle. Just to clarify this further I have given below the values for 7 top players across the ages who have not been referred to. This will clarify why these have not found a mention.
Hobbs        61  5410  56.95  785  46.18  81.1%  754  41.89  73.6%
Bradman      52  6996  99.94 1446  96.40  96.5% 1223 111.18 111.2%
Barrington   82  6806  58.67  727  51.93  88.5%  722  65.64 111.9%
Richards    121  8540  50.24  471  31.40  62.5%  550  39.29  78.2%
Lara        131 11953  52.89  812  47.76  90.3%  749  41.61  78.7%
Ponting     168 13378  51.85  670  41.88  80.8%  722  45.12  87.0%
Dravid      164 13288  52.31  773  48.31  92.3%  835  46.39  88.7%
Jayawardene 138 10806  49.57  750  46.88  94.6%  720  40.00  80.7%
Don Bradman just about missed the Great-Great combination. Richards just about missed the Poor-Poor combination. The others are right in the middle.
To download/view the list of 115 batsmen and the complete tables ordered in different forms, in Text file format, please CLICK HERE and to download/view the list of 115 batsmen and the complete tables ordered in different forms, in Excel format, please CLICK HERE.
Anantha Narayanan has written for ESPNcricinfo and CastrolCricket and worked with a number of companies on their cricket performance ratings-related systems