Dominant Australia hold the whip
Despite New Zealand being more competitive in recent matches, Australia's impressive performance in global tournaments makes them favourites
Madhusudhan Ramakrishnan
24-Feb-2011
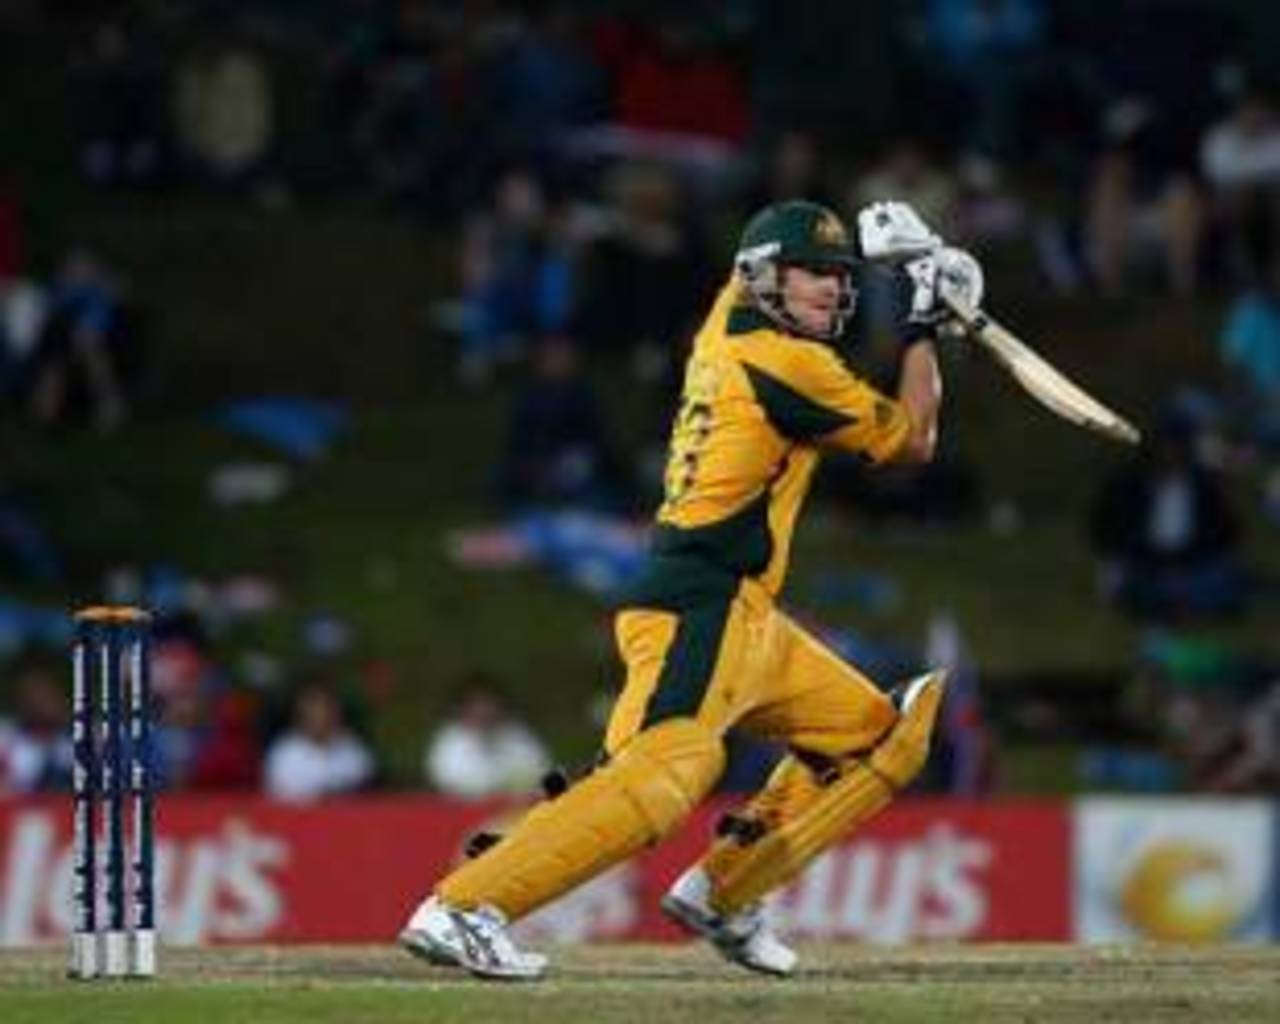
Shane Watson scored a century against New Zealand in the 2009 Champions Trophy final • Getty Images
Perhaps nothing is more indicative of Australia's dominance waning than the fact that New Zealand have managed to compete closely in their recent head-to-head clashes. New Zealand have won four and lost six of the 11 matches played between the two teams since the beginning of 2009. Between 1990 and 2009, Australia bossed the contests, winning 53 and losing just 18 of the 73 matches played. The win-loss ratio of 2.94 during that period was the best for Australia against any team other than Zimbabwe.
Since 2008, Australia have won 59 and lost 27 matches out of 90 played. In contrast, New Zealand have won 29 and lost 31 out of 68 matches. Australia followed a 6-1 series win against England in 2009 with a 4-2 win in India. They blanked Pakistan and West Indies 5-0 in early 2010 before winning a tightly contested Chappell-Hadlee Trophy 3-2, and then beating England handsomely 6-1 to restore their confidence after the Ashes defeat. New Zealand, on the other hand, come into the tournament with a very poor recent record. They last won a series in early 2010 when they beat Bangladesh at home. Since then, they have lost to Australia and then failed to win a single match against Bangladesh and India. Despite an easy win over Kenya in the opening match, New Zealand will undoubtedly need to raise their game to compete against Australia, who are on a 30-match unbeaten streak in World Cups.
Record in global tournaments
Despite New Zealand troubling them occasionally, Australia have by far been the better team in bigger tournaments. In Australia's unbeaten run through the last two World Cups, they were tested rarely; in 2003, New Zealand, led by Shane Bond's superb spell of 6 for 23 had them on the ropes at 84 for 7 in Port Elizabeth before Michael Bevan, in the company of Andy Bichel, staged another of his remarkable rescue acts to take Australia to a modest total of 208. On that occasion, Brett Lee's haul of 5 for 42 helped Australia defend the total with ease.
Despite New Zealand troubling them occasionally, Australia have by far been the better team in bigger tournaments. In Australia's unbeaten run through the last two World Cups, they were tested rarely; in 2003, New Zealand, led by Shane Bond's superb spell of 6 for 23 had them on the ropes at 84 for 7 in Port Elizabeth before Michael Bevan, in the company of Andy Bichel, staged another of his remarkable rescue acts to take Australia to a modest total of 208. On that occasion, Brett Lee's haul of 5 for 42 helped Australia defend the total with ease.
New Zealand can, however, take solace from the fact that they were one of the only two teams to inflict defeat on Australia in the last three World Cups. On that day in Cardiff in 1999, half-centuries from Roger Twose and Chris Cairns had helped beat Australia by six wickets. Since then though, there has been absolutely no competition: Australia have beaten New Zealand on the last six occasions in global tournaments, including a 215-run win in the 2007 World Cup, and more recently, a six-wicket win in the final of the Champions Trophy 2009. Shane Watson played a crucial role in both matches, scoring a rapid 65 in the World Cup game and a century in the Champions Trophy final. Australia are the dominant side when it comes to matches played in India too: they have won all five matches played between the two teams in India since 1990, including the World Cup quarter-final in Chennai in 1996.
| Played | Won | Lost | W/L ratio | |
| Overall | 123 | 84 | 34 | 2.47 |
| Global tournaments | 11 | 9 | 2 | 4.50 |
| In India | 7 | 7 | 0 | - |
| 1990-2009 | 73 | 53 | 18 | 2.96 |
| Since Jan 2009 | 11 | 6 | 4 | 1.50 |
Contrasting batting forms
Brad Haddin, who has scored both his ODI hundreds against New Zealand, has been the best batsman in matches played between the two teams since the beginning of 2009. Watson, who scored the match-winning century in the Champions Trophy final, and Cameron White have also been quite prolific against New Zealand. The form of Ricky Ponting, however, has been quite poor of late in head-to-head matches.
Brad Haddin, who has scored both his ODI hundreds against New Zealand, has been the best batsman in matches played between the two teams since the beginning of 2009. Watson, who scored the match-winning century in the Champions Trophy final, and Cameron White have also been quite prolific against New Zealand. The form of Ricky Ponting, however, has been quite poor of late in head-to-head matches.
While Scott Styris and Ross Taylor average 49.75 and 37.80 respectively against Australia in matches since January 2009, both Brendon McCullum and Martin Guptill have an average around 25 and a strike rate less than 80, which are considerably lower than their career figures.
| Batsman | Team | Matches | Runs | Average | Strike rate | 100 | 50 |
| Brad Haddin | Australia | 10 | 475 | 52.77 | 87.80 | 2 | 2 |
| Shane Watson | Australia | 6 | 297 | 59.40 | 84.85 | 1 | 1 |
| Cameron White | Australia | 10 | 257 | 51.40 | 72.39 | 0 | 3 |
| Ricky Ponting | Australia | 10 | 203 | 20.30 | 85.65 | 0 | 2 |
| Ross Taylor | New Zealand | 10 | 378 | 37.80 | 77.30 | 0 | 4 |
| Brendon McCullum | New Zealand | 11 | 268 | 24.36 | 77.23 | 0 | 1 |
| Martin Guptill | New Zealand | 11 | 261 | 26.10 | 72.70 | 0 | 1 |
| Scott Styris | New Zealand | 5 | 199 | 49.75 | 87.28 | 0 | 1 |
Australia's dominant pace attack
Australia comfortably defended 262 against Zimbabwe mainly with the help of their superb fast-bowling attack. The pace trio of Lee, Mitchell Johnson and Shaun Tait is in excellent form in the last two years and, together with Doug Bollinger and Watson, constitutes a lethal line-up capable of unsettling the best batting teams. New Zealand's bowling has revolved around Kyle Mills and Daniel Vettori for many years now. Both of them have performed consistently in matches since 2009, with Vettori in particular averaging under 28 with an economy rate of 3.95. Overall Australia have been the better pace attack in the last two years, with a significantly better average and economy rate.
Australia comfortably defended 262 against Zimbabwe mainly with the help of their superb fast-bowling attack. The pace trio of Lee, Mitchell Johnson and Shaun Tait is in excellent form in the last two years and, together with Doug Bollinger and Watson, constitutes a lethal line-up capable of unsettling the best batting teams. New Zealand's bowling has revolved around Kyle Mills and Daniel Vettori for many years now. Both of them have performed consistently in matches since 2009, with Vettori in particular averaging under 28 with an economy rate of 3.95. Overall Australia have been the better pace attack in the last two years, with a significantly better average and economy rate.
| Bowler | Team | Matches | Wickets | Average | Economy rate | 4WI | 5WI |
| Mitchell Johnson | Australia | 48 | 74 | 27.79 | 5.10 | 3 | 0 |
| Shane Watson | Australia | 52 | 57 | 23.28 | 4.95 | 1 | 0 |
| Doug Bollinger | Australia | 32 | 50 | 24.16 | 4.54 | 2 | 2 |
| Brett Lee | Australia | 20 | 33 | 24.21 | 4.92 | 0 | 1 |
| Shaun Tait | Australia | 11 | 20 | 22.85 | 4.71 | 1 | 0 |
| Kyle Mills | New Zealand | 38 | 56 | 27.58 | 5.07 | 2 | 0 |
| Daniel Vettori | New Zealand | 41 | 47 | 27.85 | 3.95 | 1 | 0 |
| Tim Southee | New Zealand | 33 | 35 | 41.00 | 5.62 | 2 | 1 |
Australia the better all-round side
In matches since 2009, Australia have scored at a better run-rate (5.54) and have a better average (35.22) against pace bowling compared to the corresponding figures of 5.27 and 27.94 for New Zealand. While New Zealand have managed to score slightly quicker against spinners (4.94 to Australia's 4.67), Australia have averaged 38.48 to New Zealand's 26.31 against spin. New Zealand have been the better team in the first ten overs, with a better economy rate and higher batting run-rate than Australia. The middle overs (20-40) and end overs (41-50) have been completely dominated by Australia. Their run-rate difference in these two phases of the innings is much better than that of New Zealand.
In matches since 2009, Australia have scored at a better run-rate (5.54) and have a better average (35.22) against pace bowling compared to the corresponding figures of 5.27 and 27.94 for New Zealand. While New Zealand have managed to score slightly quicker against spinners (4.94 to Australia's 4.67), Australia have averaged 38.48 to New Zealand's 26.31 against spin. New Zealand have been the better team in the first ten overs, with a better economy rate and higher batting run-rate than Australia. The middle overs (20-40) and end overs (41-50) have been completely dominated by Australia. Their run-rate difference in these two phases of the innings is much better than that of New Zealand.
| Team | Overs | Runs scored | Run rate | Wickets lost | Batting avg | Runs Conceded | Economy rate | Wickets taken | Bowling avg | Run rate difference |
| Australia | 1-10 | 3389 | 4.70 | 85 | 39.87 | 1835 | 5.07 | 51 | 35.98 | -0.37 |
| New Zealand | 1-10 | 2450 | 5.02 | 79 | 31.01 | 1876 | 4.70 | 44 | 42.63 | 0.32 |
| Australia | 20-40 | 6731 | 4.88 | 160 | 42.06 | 6502 | 4.86 | 210 | 30.96 | 0.02 |
| New Zealand | 20-40 | 3888 | 4.86 | 148 | 26.27 | 4407 | 5.01 | 114 | 38.65 | -0.15 |
| Australia | 41-50 | 4235 | 7.50 | 167 | 25.35 | 3004 | 6.87 | 170 | 17.67 | 0.73 |
| New Zealand | 41-50 | 2015 | 7.29 | 91 | 22.14 | 1889 | 7.09 | 96 | 19.67 | 0.20 |
Nagpur, the venue for the Trans-Tasman clash, is one of the most batting friendly venues in India in recent years. There have been 1800 runs scored in three matches played. Except in the first game there when India amassed 354 and comfortably beat Australia by 99 runs, the other two occasions have seen teams chasing down big scores successfully. Sri Lanka chased India's 301 in 2009 and more recently, England overhauled Netherlands' 292 in their first World Cup game. On a flat wicket, spinners have done slightly better than fast bowlers: they average 49.33 at an economy rate of 5.39 while fast bowlers average over 51 at an economy rate of 6.28.