Australia hold clear advantage
Australia have excellent records against Pakistan and in World Cups, but Pakistan have some weapons which could hurt the Australians on Saturday
Madhusudhan Ramakrishnan
18-Mar-2011
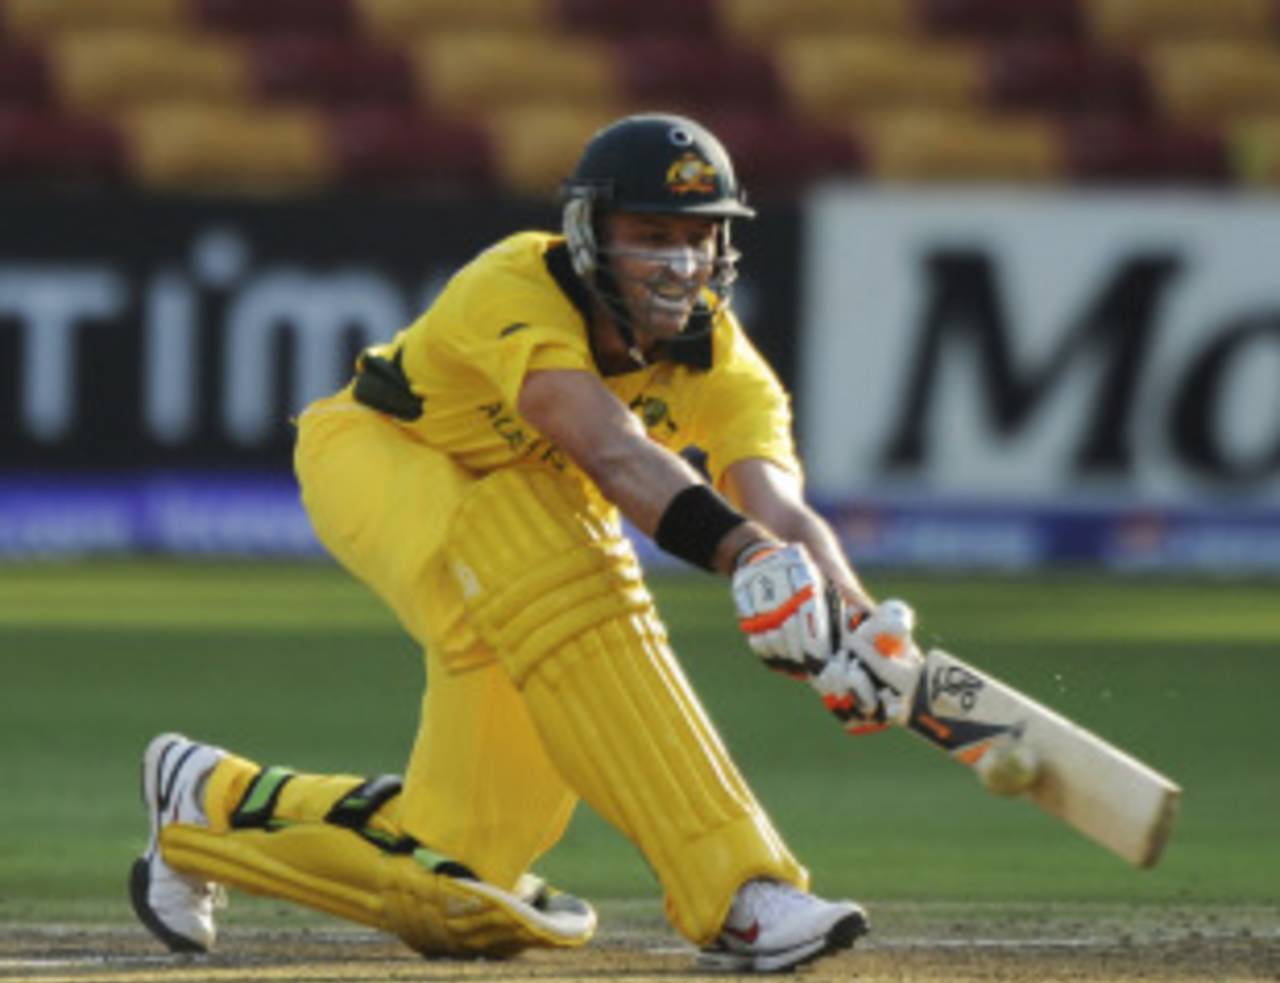
Michael Hussey: superb record against Pakistan in all forms of the game • AFP
Australia against Pakistan pits one of the most efficient and successful ODI teams against one of the most talented and unpredictable ones. Though Australia haven't been at their best in the tournament so far, they have still managed to register fairly convincing wins. In contrast, Pakistan have blown hot and cold. They defeated Sri Lanka but lost heavily against New Zealand. The head-to-head contests between the two teams in recent years have proved to be extremely one-sided. Australia have been ruthless in matches played against Pakistan since 2000, winning 26 and losing just seven. With nine wins in 11 meetings since 2007, Australia's dominance has been even more pronounced in recent matches.
Pakistan came close in the ODI series played in Abu Dhabi and Dubai in 2009, eventually losing 3-2. The following series in Australia in 2010 was a no-contest with the hosts winning 5-0. While Pakistan have been able to upset many other teams in bigger tournaments, they have not quite been able to do the same against Australia. They have let Australia off the hook on numerous occasions, in all formats, and allowed them to seize control. Two of the most recent matches when Pakistan had a great chance to win include the infamous Sydney Test and the World Twenty-20 semi-final. In the semi-final, Michael Hussey's remarkable hitting in the last few overs gave Australia a win in a game in which they seemed to have lost. Pakistan can, however, take heart from their excellent performance in the Champions Trophy in 2009 when they put up a superb fight in a close loss to Australia.
Australia's 34-match undefeated streak in World Cups started just after their 10-run loss to Pakistan in the 1999 World Cup. Pakistan's unpredictability came to the fore In their next meeting against Australia in the final of the same tournament, where they were bowled out for just 132. In the 2003 World Cup, Pakistan again had Australia in trouble at 86 for 4 before a fantastic century from Andrew Symonds carried Australia to 310 and a comfortable win. Pakistan, having defeated Sri Lanka in a tight contest, will have the advantage of knowing the conditions in Colombo while Australia, whose game at the venue was abandoned, will come into the game hoping for a challenging contest before the knockout stages.
| Played | Won | Lost | W/L ratio | |
| Overall | 85 | 52 | 29 | 1.79 |
| Since 2000 | 34 | 26 | 7 | 3.71 |
| In Asia since 2000 | 5 | 3 | 2 | 1.50 |
| Since 2007 | 11 | 9 | 2 | 4.50 |
| In global tournaments | 8 | 5 | 3 | 1.67 |
The gulf between the two sides is far more evident if the batting and bowling stats are compared. Australia are far ahead on both fronts in ODIs played since 2008. Pakistan, though, have a slightly quicker rate of scoring which is predominantly because of more matches played in batting-friendly conditions. Australia have a stunning record in India and have a win-loss ratio of 1.87 against India in ODIs in India since 2000. Pakistan, despite having a fairly good record themselves in India, are still much poorer in terms of the batting and bowling averages. In global tournaments since 2003, Australia are unmatched. With 36 wins and only two losses, they are by far ahead of any other ODI team. The difference between their batting and bowling runs-per-wicket figure is an almost unbelievable 29.39.
| Team | Period | Matches | W/L ratio | Avg(batting) | RR | Avg(bowling) | ER | Avg diff | RR diff |
| Australia(overall) | 2008-2011 | 94 | 2.29 | 35.75 | 5.22 | 26.08 | 4.88 | 9.67 | 0.34 |
| Pakistan(overall) | 2008-2011 | 70 | 1.22 | 30.89 | 5.24 | 30.41 | 5.05 | 0.48 | 0.19 |
| Australia (in India) | 2000-2011 | 35 | 2.77 | 41.53 | 5.50 | 27.84 | 5.04 | 13.69 | 0.46 |
| Pakistan (in India) | 2000-2011 | 15 | 1.14 | 34.34 | 5.62 | 34.92 | 5.53 | -0.58 | 0.09 |
| Australia (in global tournaments) | 2003-2011 | 40 | 18.00 | 50.28 | 5.65 | 20.87 | 4.45 | 29.39 | 1.20 |
| Pakistan (in global tournaments) | 2003-2011 | 24 | 1.09 | 25.71 | 4.84 | 23.68 | 4.66 | 2.03 | 0.18 |
Australia average higher and score at a faster rate in the first ten overs in ODIs played since 2008. Pakistan's frail top order has meant that they have been unable to stitch together many decent partnerships. In the middle overs, Pakistan have been slightly more adept at handling spin. They have scored slightly faster than Australia and have also been more economical in the same period while bowling. Pakistan's powerful middle order of Abdul Razzaq and Shahid Afridi has meant that they score at 7.51 runs per over in the end overs which is second only to South Africa's 7.76. Pakistan, who were guilty of conceding more than 100 runs against New Zealand in the last five overs of their game in Pallekele, have been less economical than Australia in the final overs of the innings.
| Team | Period(overs) | Batting average | Run rate | Bowling average | Economy rate | Run rate difference |
| Australia | 0-15 | 43.72 | 4.85 | 29.45 | 4.56 | 0.29 |
| Pakistan | 0-15 | 35.79 | 4.47 | 35.59 | 4.88 | -0.41 |
| Australia | 16-40 | 40.54 | 4.75 | 29.45 | 4.64 | 0.11 |
| Pakistan | 16-40 | 35.14 | 5.07 | 32.59 | 4.60 | 0.47 |
| Australia | 41-50 | 24.36 | 7.39 | 17.05 | 6.70 | 0.69 |
| Pakistan | 41-50 | 21.04 | 7.51 | 22.03 | 7.08 | 0.43 |
Shane Watson has been one of Australia's best batsmen in the last three years and has scored his runs with a high percentage of boundaries. After an indifferent start to the tournament, he played himself back into form against Canada with an aggressive 94. His partnership with Brad Haddin has been one of the most successful opening combinations for Australia and will be a huge threat for Pakistan. Michael Clarke has been in excellent touch in ODIs while the inclusion of Michael Hussey is a boost to Australia's middle order not just because of Hussey's brilliance in ODIs, but also because of his record against Pakistan in all forms of the game. Hussey has maintained an excellent strike rate and has the lowest dot-ball percentage among top-order Australian batsmen.
The two batsmen who haven't showed form so far in the tournament are Cameron White and Ricky Ponting. Ponting, who is the second-highest run-getter in World Cups, has scored just 83 runs in the 2011 tournament at an average of under 21.Of Ponting's 29 ODI hundreds, 25 have come in wins, but Australia have also won a high percentage of their matches under Ponting's captaincy when he has scored less than 25.
| Batsman | Matches | Average | SR | 100s | 50s | % boundary runs scored | % dot-balls |
| Michael Hussey | 78 | 48.87 | 87.30 | 0 | 24 | 31.02 | 42.44 |
| Shane Watson | 63 | 45.75 | 89.28 | 5 | 15 | 53.98 | 54.53 |
| Michael Clarke | 71 | 44.87 | 73.03 | 2 | 21 | 31.19 | 52.07 |
| Cameron White | 66 | 38.33 | 79.79 | 2 | 11 | 40.86 | 51.34 |
| Ricky Ponting | 69 | 35.30 | 79.49 | 4 | 16 | 43.77 | 54.11 |
Apart from Misbah-ul-Haq and Younis Khan, the rest of the Pakistani batting has been highly inconsistent in recent matches. Kamran Akmal, who scored 116 in Pakistan's most recent win over Australia, has a fairly high boundary percentage and could be a key batsman. Afridi has an extraordinary strike rate over 130 and a very low dot-ball percentage, but he will be up against a high-class pace attack on Saturday.
| Batsman | Matches | Average | SR | 100s | 50s | % boundary runs scored | % dot-balls |
| Misbah-ul-Haq | 45 | 47.31 | 80.23 | 0 | 11 | 35.71 | 49.59 |
| Younis Khan | 58 | 32.51 | 76.81 | 3 | 12 | 34.85 | 50.83 |
| Kamran Akmal | 50 | 30.73 | 86.85 | 2 | 7 | 54.73 | 57.03 |
| Shahid Afridi | 68 | 25.58 | 130.76 | 2 | 3 | 56.00 | 38.19 |
Australa's pace attack has proved to be expensive in the early overs in the last two games. However, Brett Lee, Shaun Tait and Mitchell Johnson have excellent strike rates and form a potent new-ball attack. The spinners Jason Krejza and Steven Smith have not been very effective, though, and on a track that is likely to assist spin, their bowling could be a vital factor against a Pakistan line-up that generally handles spin quite well.
Afridi, the highest wicket taker in the tournament, has also bowled superbly against Australia in recent ODIs. He will however, hope for a far more consistent performance from his pace attack which went for more than 100 runs in the last few overs against New Zealand.
While Australia's pace attack has a better average and lower boundary percentage than Pakistan's, their spin attack is not quite as potent. Pakistan spinners, dspite averaging slightly higher, have been more economical and conceded fewer runs in boundaries than their Australian counterparts.
| Type of bowler | Team | Average | Economy rate | % boundaries | % dot-balls |
| Pace | Australia | 26.39 | 4.73 | 45.14 | 62.00 |
| Spin | Australia | 34.04 | 4.83 | 29.50 | 48.58 |
| Pace | Pakistan | 30.26 | 5.17 | 47.23 | 59.70 |
| Spin | Pakistan | 34.79 | 4.64 | 27.52 | 50.88 |
The Premadasa stadium in Colombo is one of the toughest wickets to chase on and is loaded in favour of teams batting first. In day-night games, winning the toss provides a distinct advantage. Teams batting first have won 17 and lost just three of the last 22 day-night games that have been played at the venue.