South Africa flourish, England struggle
A detailed look at how teams and players have fared during the batting Powerplays
S Rajesh
15-Mar-2011
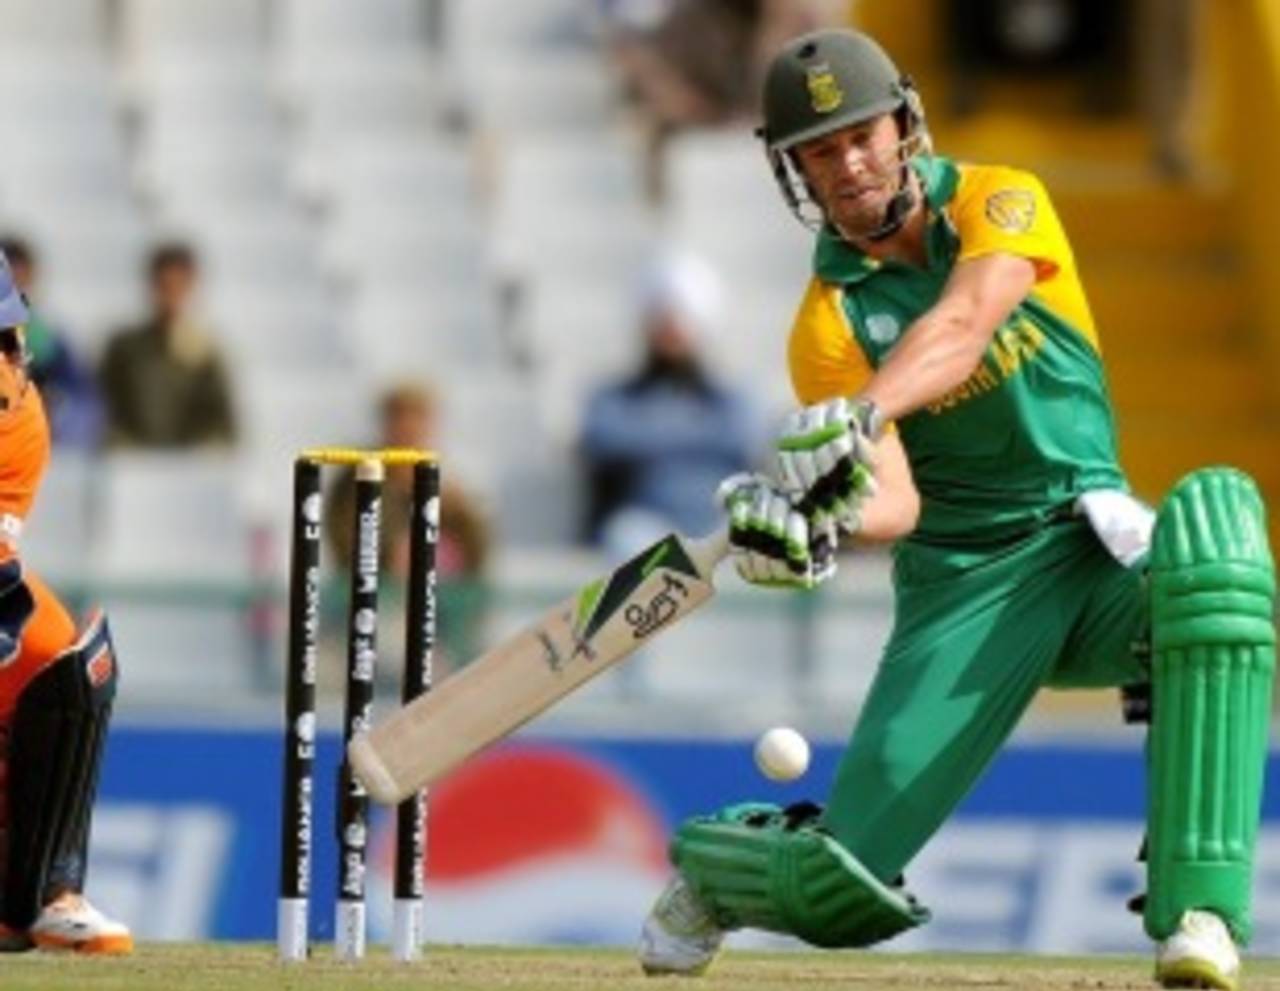
AB de Villiers: 78 runs off 32 deliveries in the batting Powerplays • Getty Images
The batting Powerplay was designed to offer further assistance to the already pampered batsmen in ODIs, but so far in the World Cup it hasn't always worked out that way. Captains have sometimes struggled to figure out the best time to use them, and when it's been taken, batsmen have taken the meaning of the term too literally, trying the belt every ball out of the ground. It has disrupted the rhythm of batsmen who've been used to taking singles in the middle overs, and on occasions it's ended up being a curse for the batting team rather than a blessing.
A couple of games involving India offered good examples of what could go wrong for a dominant team in these five overs. Against England, the batting Powerplay turned around what seemed to be a lost cause for India, as they took four England wickets and conceded only 25 runs, which is the worst performance in the batting Powerplay in this World Cup by one of the big teams. India were themselves at the receiving end against South Africa in what's the second-worst batting Powerplay performance so far, losing 4 for 30 and completely messing up an innings which seemed to be soaring towards great heights.
The overall stats for the Powerplays in this World Cup show that while the overall run-rates are fairly low for the mandatory and bowling Powerplays, it goes up to almost eight runs per over in the batting one. The overall average, though, drops from the mid-30s in the other two Powerplays to the mid-20s, with the average batting Powerplay score being about 40 for 2.
All these numbers, though, get skewed because of the presence of the smaller teams. The top nine teams average 8.37 runs per over and 24.51 runs per wicket in the batting Powerplays; in the mandatory one, they average 5.29 per over and 49.95 per wicket, which is significantly better than the overall tournament stats.
| Powerplay type | Runs | Wickets | Average | Run rate |
| Mandatory | 3051 | 87 | 35.06 | 4.72 |
| Bowling | 1362 | 42 | 32.42 | 4.41 |
| Batting | 1609 | 70 | 22.98 | 7.96 |
The timing of the batting Powerplay has been one of the big points of debate in this World Cup. There's an argument in favour of taking it early if a team has got off to a good start, but captains have preferred to wait till at least the 35th over, when the mandatory ball change happens. Most often - 33 times out of 49 so far - the batting Powerplay has been taken from the 40th over onwards.
Twice, the batting Powerplay has been taken before 30 overs, but on both occasions, the result of the match was a foregone conclusion by then: Canada took it in the 28th against Sri Lanka when they were 75 for 7 chasing 333, while Sri Lanka took it in the 16th against Kenya when they were 110 for 1 chasing 143. In neither case was it a tactical move by a captain who wanted to wrest the initiative.
There have been 14 instances of the batting Powerplay being taken between overs 30 and 39. Ireland timed it superbly in that fantastic run-chase against England when they took it in the 32nd over and creamed 62 without losing any wicket. New Zealand did it well too, against Canada, taking it in the 37th over when they were only two down, and scoring an incredible 74 runs for the loss of two wickets, which is the highest by any team in the batting Powerplay in this World Cup. West Indies used it to recover from a slow start against Ireland, scoring 55 without losing a wicket after taking it in the 36th over.
In most of these cases, teams have taken the batting Powerplay when they've had wickets in hand and two batsmen have been pretty well set. That's allowed the teams to make good use of the fielding restrictions. The other benefit, which can't always be shown in terms of Powerplay numbers, is that taking it forces the opposition to bowl out their best bowler(s) early, which means lesser bowlers have to bowl at the end of the innings: in their match against New Zealand, Pakistan were forced to bowl Umar Gul during the Powerplay, and Ross Taylor and Co then attacked Shoaib Akhtar and Abdul Razzaq quite mercilessly in the last four overs.
On the 13 occasions when teams have taken the batting Powerplay between 30 and 39, they've averaged more than nine runs per over; when taken after 39, the run-rate drops to 7.47, though that's also because of cases when teams have already lost lots of wickets and can't fully exploit the field restrictions. The lack of specialist batsmen also means teams tend to lose more wickets in these Powerplays, which explains the low average.
| When taken | Innings | Runs | Balls | Wickets | Average | Run rate |
| before 30 overs | 2 | 65 | 52 | 1 | 62.00 | 7.50 |
| 30-39 overs | 14 | 564 | 373 | 13 | 43.38 | 9.07 |
| 40 overs onwards | 33 | 980 | 787 | 56 | 17.50 | 7.47 |
Thanks largely to that blitz against Canada, New Zealand's batting run-rate in Powerplay overs is the best among all teams in this World Cup so far. South Africa and West Indies, though, are the only two teams to score more than 50 twice during the batting Powerplays. Among the top teams, England have struggled the most during these five overs, losing 12 wickets - easily the most by any team - and averaging only 6.40 runs per over.
In terms of bowling performances, South Africa lead the way by quite a margin: they've taken nine wickets at an average of less than seven, and an economy rate of less than five runs per over. Coupled with their batting run-rate, it can safely be said that South Africa have been the best team, overall, in the batting Powerplays. West Indies have good numbers too with the ball, but the only team which took a batting Powerplay against them was Ireland. India have taken the most wickets - 13 - and have a respectable economy rate too.
| Team | Bat average | Run rate | Bowl average | Econ rate |
| New Zealand | 21.50 | 10.60 | 30.00 | 7.94 |
| South Africa | 21.50 | 10.18 | 6.67 | 4.93 |
| Pakistan | 52.33 | 9.81 | 15.20 | 6.60 |
| West Indies | 40.00 | 9.60 | 14.00 | 5.60 |
| Sri Lanka | 33.20 | 8.89 | 28.33 | 5.66 |
| Netherlands | 22.20 | 8.53 | 32.80 | 9.93 |
| Ireland | 28.25 | 8.16 | 45.67 | 8.93 |
| Australia | 38.50 | 7.70 | 23.33 | 8.23 |
| India | 25.20 | 7.20 | 13.23 | 7.31 |
| Kenya | 34.00 | 6.80 | 43.25 | 10.07 |
| Bangladesh | 18.00 | 6.75 | 33.33 | 7.50 |
| Canada | 15.50 | 6.48 | 18.20 | 8.67 |
| England | 13.16 | 6.40 | 37.20 | 8.58 |
| Zimbabwe | 12.00 | 5.40 | 43.00 | 8.60 |
The stars of the batting Powerplays
The pressure is often on the fielding team in these Powerplays, but the onus is also on the batsmen to lift the tempo and utilise the fielding restrictions. Some batsmen have handled this better than the others, reveals the table below. AB de Villiers has scored 78 in 32 balls, taking 51 off 18 against Netherlands, and 27 off 14 against India. The record for most runs in a batting Powerplay in this World Cup, though, belongs to Ross Taylor - against Canada, he scored 54 off 20. A couple of performances by associate batsmen against England deserve honourable mention too - Kevin O'Brien hammered 45 off 16, while Ryan ten Doeschate managed 35 from 16.
There are other batsmen, though, who haven't enjoyed these Powerplays as much: Ian Bell is one of only two batsmen to be dismissed thrice, scoring 27 in 28 balls, while Jonathan Trott has scored 19 in 20 balls and fallen twice. Sachin Tendulkar has been dismissed twice in ten balls in the batting Powerplays, scoring 11 runs.
| Batsman | Runs | Balls | Dismissals | Average | Run rate |
| AB de Villiers | 78 | 32 | 1 | 78.00 | 14.62 |
| Ross Taylor | 67 | 34 | 1 | 67.00 | 11.82 |
| Kieron Pollard | 65 | 31 | 0 | - | 12.58 |
| Upul Tharanga | 61 | 35 | 1 | 61.00 | 10.45 |
| Ryan ten Doeschate | 53 | 31 | 0 | - | 10.25 |
| Umar Akmal | 48 | 26 | 1 | 48.00 | 11.07 |
| Kevin O'Brien | 45 | 16 | 0 | - | 16.87 |
Not surprisingly, Dale Steyn has the best numbers among bowlers, with four wickets for 18 runs at an economy rate of less than 3.50. Against India he took 2 for 7 off 12 balls, while against West Indies he had 2 for 3 off nine deliveries. Zaheer Khan is the highest wicket-taker, though, with seven, including a haul of 3 for 11 from 18 balls against England, a spell which turned the match around. His only poor game during the batting Powerplay came against South Africa, when he conceded 22 in two overs.
| Bowler | Balls | Runs | Wickets | Average | Econ rate |
| Dale Steyn | 33 | 18 | 4 | 4.50 | 3.27 |
| Muttiah Muralitharan | 42 | 32 | 3 | 10.67 | 4.57 |
| Zaheer Khan | 64 | 53 | 7 | 7.57 | 4.96 |
| Umar Gul | 34 | 31 | 3 | 10.33 | 5.47 |
| Ryan ten Doeschate | 36 | 38 | 4 | 9.50 | 6.33 |
Steyn, Zaheer and Gul are among the strike bowlers who've handled the challenge of the batting Powerplay well, but one fast bowler who hasn't done as well is James Anderson. He has been a disappointment in the tournament as a whole, taking four wickets at 70.50 runs per wicket and 6.55 runs per over, and in the batting Powerplays too he has been far too loose, conceding 26 in 12 balls against Ireland, 16 in 12 against Bangladesh when they were eight down, and 14 from six against Netherlands. Given these numbers, it's a doubt if he'll be entrusted with bowling duties in the batting Powerplay in England's must-win game against West Indies.
| Bowler | Balls | Runs | Wickets | Average | Econ rate |
| Mudassar Bukhari | 30 | 50 | 0 | - | 10.00 |
| James Anderson | 42 | 68 | 1 | 68.00 | 9.71 |
All stats updated till the match between Pakistan and Zimbabwe on March 14.
S Rajesh is stats editor of ESPNcricinfo