Daredevils' blunt bowling
Daredevils' bowling average of 46.28 isn't just the worst for any team this season; it's the worst by any team in any IPL season, and by quite a distance
S Rajesh
10-May-2014
Blunt weapon: Delhi Daredevils average 3.5 wickets per match • BCCI
The leading wicket-taker for Delhi Daredevils is Jaydev Unadkat, with six; the leading wicket-takers in the tournament are Bhuvneshwar Kumar and Mohit Sharma, with 14. Between the table toppers and Unadkat, there are 19 other bowlers who've taken more than six wickets, which is a good indicator of how the Daredevils have struggled with the ball this season.
In eight matches in IPL 2014, Daredevils have taken 28 wickets, which is an average of 3.5 wickets per match. In five of their eight matches, they've failed to take more than three wickets: in Daredevils' first game, Royal Challengers Bangalore scored 146 for 2 in a successful run-chase; a couple of games later, Sunrisers Hyderabad scored 184 for 1 against them batting first; and since the tournament returned to India, they've had the following totals scored against them - 156 for 3 by Rajasthan Royals, 181 for 2 by Chennai Super Kings, and 161 for 2 by Kolkata Knight Riders.
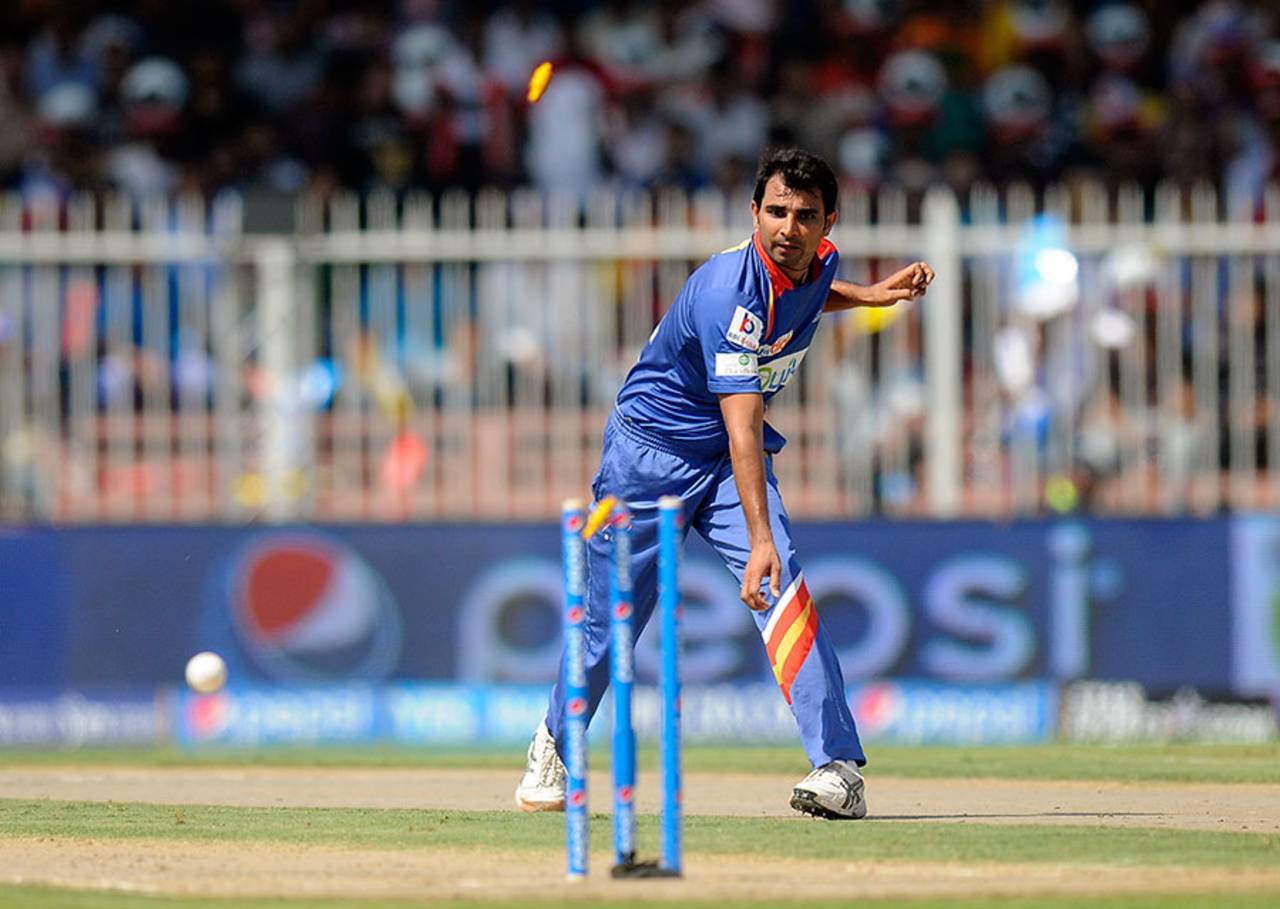
In the entire tournament, Daredevils have conceded 46.28 runs per wicket for their 28 scalps; Kings XI have taken more than twice as many wickets - 57, at an average of 22.33 - while Super Kings and Royals have taken 53 each. The next-highest bowling average in the tournament is 31.96 runs per wicket, for Mumbai Indians. For Daredevils, apart from Unadkat's six wickets at 35.33, Wayne Parnell has five wickets at 31, but most of the other bowlers have struggled for wickets: Mohammad Shami's four wickets have cost 66.75 each, while Shahbaz Nadeem, the left-arm spinner, has five at an average of 44.80. Rahul Sharma, Jimmy Neesham, Laxmi Ratan Shukla and JP Duminy have combined figures of 3 for 335 from 39 overs.
Daredevils' bowling average of 46.28 isn't just the worst for any team this season; it's the worst by any team in any IPL season, and by quite a distance: the next-poorest bowling average for a team in any season is 34.43, by Deccan Chargers in 2008. And as the tables below show, they've struggled for wickets at each stage of a T20 innings - their Powerplay and middle overs bowling average is the second-worst by any team in a season, and their last-five-over average is the worst, by far.
| Team | Season | Matches | Wickets | Average | Econ rate | W/ L |
| Delhi Daredevils | 2014 | 8 | 28 | 46.28 | 8.46 | 2/ 6 |
| Deccan Chargers | 2008 | 14 | 67 | 34.43 | 8.72 | 2/ 12 |
| Royal Challengers Bangalore | 2008 | 14 | 65 | 33.92 | 8.43 | 4/ 10 |
| Kolkata Knight Riders | 2009 | 13 | 59 | 33.16 | 7.87 | 3/ 9 |
| Kings XI Punjab | 2010 | 14 | 73 | 32.39 | 8.73 | 3/ 10 |
| Delhi Daredevils | 2013 | 16 | 76 | 32.05 | 7.94 | 3/ 12 |
| Team | Season | Overs | Wkts | Average | Econ rate |
| Royal Challengers Bangalore | 2008 | 84.0 | 12 | 55.08 | 7.86 |
| Delhi Daredevils | 2014 | 48.0 | 7 | 49.42 | 7.20 |
| Team | Season | Overs | Wkts | Average | Econ rate |
| Mumbai Indians | 2014 | 63.0 | 8 | 61.62 | 7.82 |
| Delhi Daredevils | 2014 | 72.0 | 12 | 46.50 | 7.75 |
| Team | Season | Overs | Wkts | Average | Econ rate |
| Delhi Daredevils | 2014 | 33.1 | 9 | 43.55 | 11.81 |
| Kolkata Knight Riders | 2013 | 55.2 | 18 | 29.77 | 9.68 |
S Rajesh is stats editor of ESPNcricinfo. @rajeshstats