England's mid-overs slump, NZ's mid-order heroics
England's ODI travails have largely been due to their sluggish batting in the middle overs, while the fourth-wicket stand has been the most prolific for New Zealand in Tests this decade
S Rajesh
27-Mar-2009
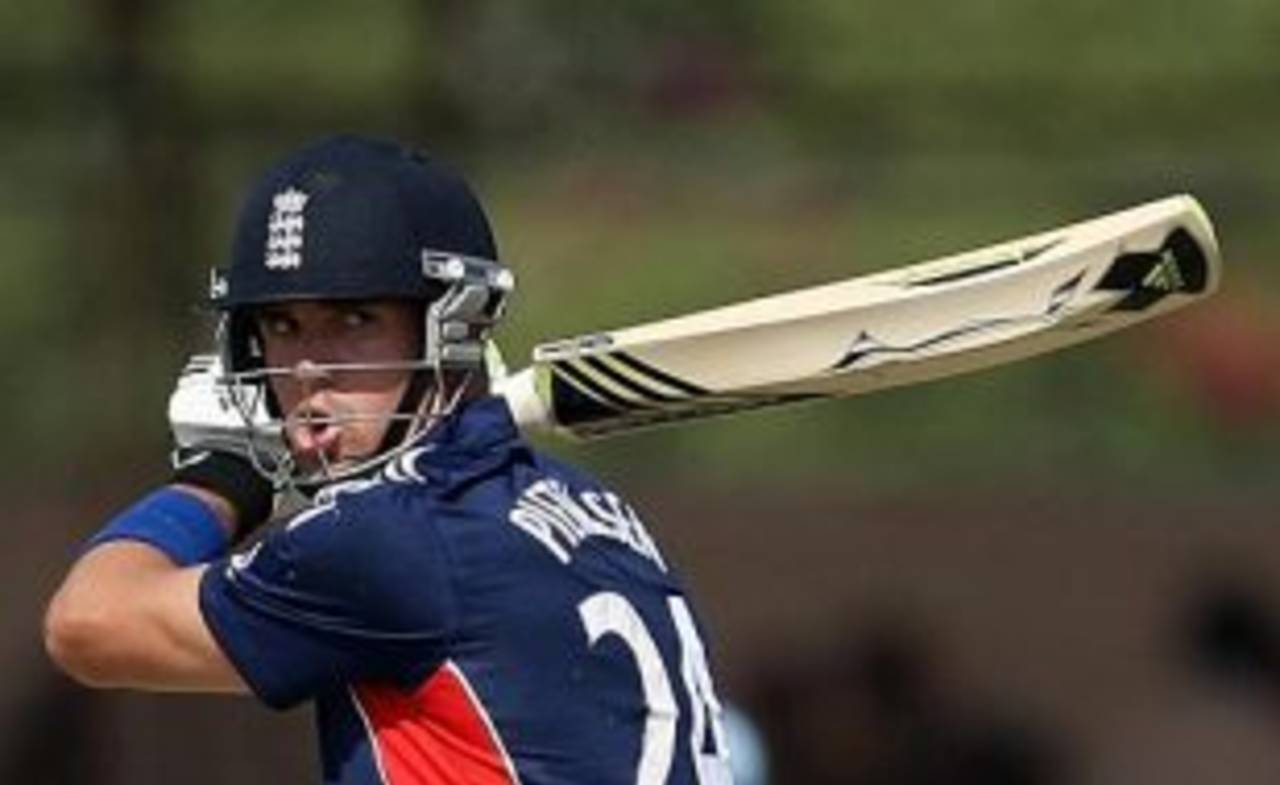
Kevin Pietersen has been doing an excellent job in the middle overs, but he desperately needs more support from England's batsmen • AFP
Not much has been going right for England on their tour of the West Indies: they came close to winning two Tests but ultimately lost the series 1-0, and they might well be 2-0 down in the ODI series had John Dyson not messed up with the columns of the D/L sheet.
England haven't been among the top ODI sides for a while now, though they've managed the odd upset win, most notably when they beat Australia in the CB Series in 2007 and then upset Sri Lanka in Sri Lanka. However, for the most part, they've struggled to compete against the top teams, which is reflected in the table below: of the last 90 ODIs they've played against the top teams (excluding Bangladesh, Zimbabwe and the other non-Test-playing teams) since the beginning of 2005, they've won only 30 and lost 52, a dismal win-loss ratio of 0.57, which, among these eight sides, is only better than West Indies.
A look at their team-wise results shows that while the results against South Africa, Pakistan and Australia have been reasonable, they've fallen short repeatedly against India and New Zealand, losing 23 out of 34 games against them.
| Team | ODIs | Won/ lost | W-L ratio | Runs per wkt | RPO |
| Australia | 107 | 66/ 30 | 2.20 | 37.44 | 5.40 |
| South Africa | 79 | 48/ 26 | 1.84 | 34.64 | 5.12 |
| India | 122 | 64/ 51 | 1.25 | 33.97 | 5.32 |
| Pakistan | 74 | 36/ 35 | 1.02 | 31.27 | 5.12 |
| New Zealand | 82 | 34/ 39 | 0.87 | 30.21 | 5.16 |
| Sri Lanka | 92 | 37/ 49 | 0.75 | 29.48 | 5.00 |
| England | 90 | 30/ 52 | 0.57 | 28.45 | 4.95 |
| West Indies | 79 | 21/ 54 | 0.38 | 27.13 | 4.84 |
The second ODI against West Indies was a good template for what has been going wrong with the England team, especially with the bat. Chasing 265 for victory, they began reasonably well, and were a comfortable 73 for 2 after 15 overs, well ahead of what West Indies were at a similar stage in their innings.
Then came the slide. Owais Shah and Paul Collingwood fell in the 20th over, Matt Prior went three overs later, and from there England were always fighting a losing battle, though Andrew Strauss tried valiantly. Between overs 16 and 40, England scored 107 for 5, while West Indies utilised that period far more effectively, scoring 149 for 2. Even though England scored more in the first 15 and the last 10, the manner in which they botched up the middle overs lost them the game.
| Team | First 15 - runs/ wkts | RPO | 16-40 - runs/ wkts | RPO | 41-50 - runs/ wkts | RPO |
| West Indies | 58/ 2 | 3.86 | 149/ 2 | 5.96 | 57/ 4 | 5.70 |
| England | 73/ 2 | 4.86 | 107/ 5 | 4.28 | 63/ 3 | 6.30 |
That game wasn't a one-off, either. Over the last few years England's biggest problem in ODIs has been the phase between overs 16 and 40. Compared to other top teams, they are well behind the eight-ball, losing more wickets and scoring at a slower rate than the others. Australia average 46.14 runs per wicket during this period against the other top teams, and score at five per over; South Africa, India and Pakistan average more than 40 per wicket, but for England the number drops to 28.86, the least among these eight teams. At 4.61, the run-rate is the worst too. While Australia, on an average, score 125 for the loss of 2.7 wickets during these 25 overs, England score 115 for 4. The loss of two extra wickets ensures England have far fewer quality resources at hand during the slog overs.
| Team | Innings | Runs per wkt | Runs per over | Dot ball % | Balls per boundary |
| Australia | 101 | 46.14 | 5.00 | 53.52 | 13.99 |
| South Africa | 76 | 42.05 | 4.77 | 52.84 | 15.95 |
| India | 118 | 40.64 | 5.06 | 54.60 | 12.82 |
| Pakistan | 73 | 40.22 | 4.92 | 52.53 | 15.35 |
| Sri Lanka | 87 | 36.83 | 4.68 | 54.47 | 16.39 |
| New Zealand | 76 | 34.95 | 4.87 | 55.53 | 14.83 |
| West Indies | 78 | 32.58 | 4.65 | 57.71 | 15.22 |
| England | 86 | 28.86 | 4.61 | 56.51 | 16.20 |
The table below indicates Kevin Pietersen needs massive support during the middle overs, since most of the time he wages a lone battle. When he gets out early - as he did in that second ODI, in Guyana - England usually struggle. He is the one batsman in the team, though, who has worked out the middle overs perfectly, averaging more than 50, at a scoring-rate of more than five. Collingwood has reasonable numbers, as does Ian Bell, but most of the others haven't quite got the measure of these overs: Shah, for instance, has a decent average, but scores his runs at a niggardly 3.92 per over, which in most cases hardly helps the cause of the batsmen coming in after him. Expecting another Pietersen to turn up in the middle order is unreasonable, but England will be happy with someone who is about 80% as good as him. So far, even that has been a tall order.
| Batsman | Innings | Runs | Average | RPO |
| Kevin Pietersen | 53 | 1673 | 50.69 | 5.09 |
| Paul Collingwood | 71 | 1597 | 32.59 | 4.35 |
| Ian Bell | 39 | 901 | 33.37 | 4.46 |
| Andrew Flintoff | 38 | 655 | 23.39 | 4.44 |
| Owais Shah | 29 | 549 | 34.31 | 3.92 |
| Andrew Strauss | 22 | 526 | 27.68 | 4.70 |
| Ravi Bopara | 21 | 356 | 27.38 | 4.12 |
| Jamie Dalrymple | 18 | 269 | 33.62 | 3.44 |
| Geraint Jones | 18 | 235 | 19.58 | 3.57 |
| Stuart Broad | 16 | 109 | 13.62 | 3.49 |
Fourth-wicket to the rescue
That the fourth-wicket pair resuscitated New Zealand after the loss of three early wickets wasn't surprising, for that's been their most prolific partnership over the last nine years. For most teams, you'd expect the top three pairs to get most of the runs, but not so for New Zealand. Jesse Ryder and Ross Taylor put together the team's 13th hundred partnership for the fourth wicket since 2000, in 125 innings. It's the highest number of century stands for any wicket, with 11 being the next best, for the second wicket. What's also interesting is the number of different pairs that have batted for the fourth wicket - 53, for 125 stands, or an average of less than two-and-a-half stands per pair.
Even more surprising, though, are the numbers for the opening wicket. In terms of averages, the first-wicket stand languishes third from bottom, with only the partnerships for the ninth and 10th wickets doing worse. In 133 tries, only 23 times has the opening pair scored 50 or more.
| Wicket | Innings | Runs | Average p'ship | 100s/ 50s stand |
| Fourth | 125 | 4862 | 40.18 | 13/ 22 |
| Fifth | 122 | 4451 | 38.04 | 8/ 28 |
| Second | 131 | 4677 | 37.11 | 11/ 26 |
| Seventh | 112 | 3770 | 35.90 | 7/ 17 |
| Sixth | 117 | 3669 | 32.46 | 5/ 22 |
| Third | 127 | 4018 | 32.40 | 7/ 16 |
| Eighth | 105 | 3229 | 31.97 | 5/ 11 |
| First | 133 | 3924 | 29.95 | 6/ 17 |
| Ninth | 101 | 1983 | 20.23 | 0/ 12 |
| Tenth | 88 | 1056 | 12.42 | 1/ 1 |
S Rajesh is stats editor of Cricinfo