ESPNcricinfo Awards 2012: Clarke and Ajmal take top honours
The players of 2012, as decided by the numbers. Also starring Shane Watson, Ian Bell and Mohammad Hafeez
S Rajesh
Mar 11, 2013, 4:26 AM
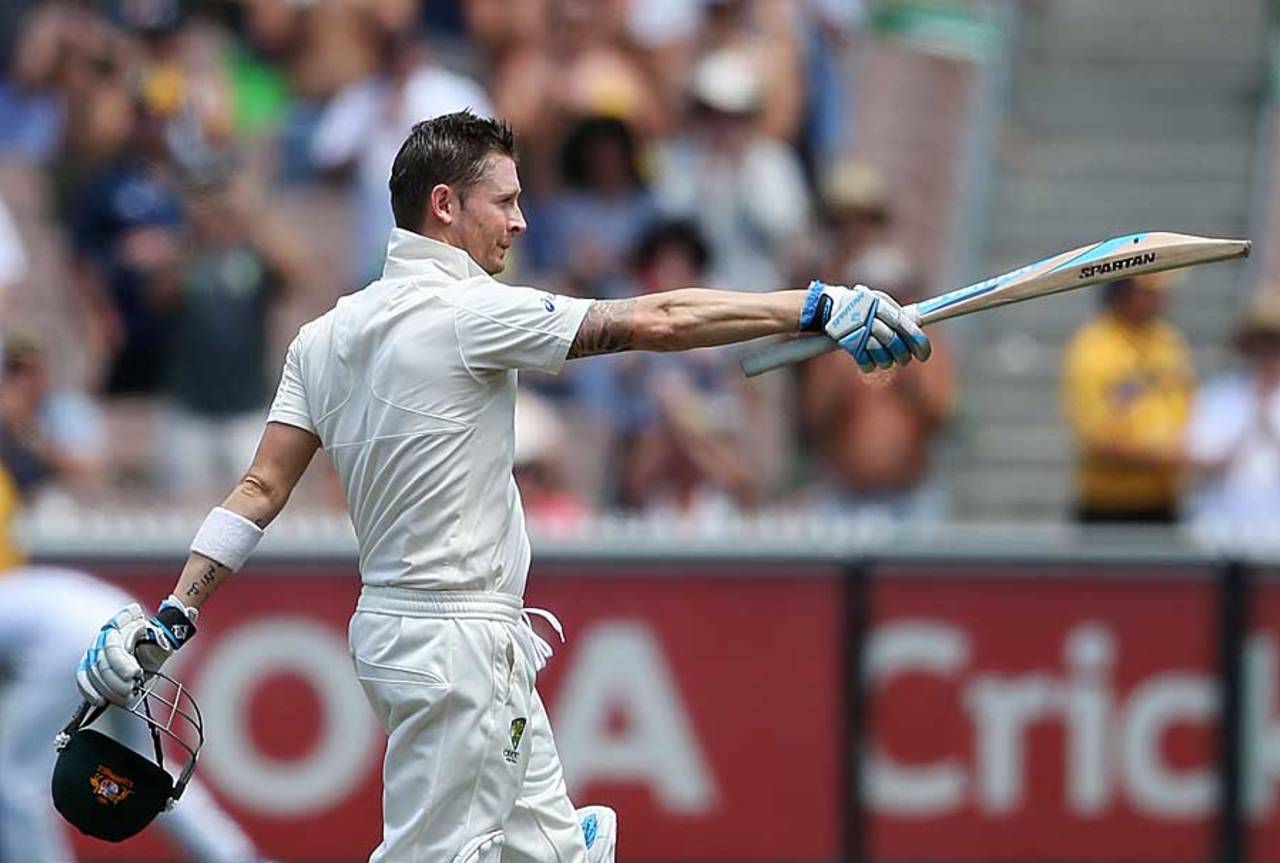
Michael Clarke was easily the best batsman of 2012 • Getty Images
The Statsguru Awards are based purely on numbers from international matches in 2012. However, they go beyond the usual stats - runs scored, wickets taken, batting averages and such - and are based instead on detailed data analyses of performances. Which batsman played more consistently than any other over the entire year? Which batting pair was the most prolific through the year? Which bowler was at his best in the third and fourth innings of Tests? Read on to find out. (All ODI and T20I stats include performances against Test-playing sides only.)
Main awards
Batsman of the year
(cut-off: 800 runs in Tests, 500 in ODIs)
(cut-off: 800 runs in Tests, 500 in ODIs)
Michael Clarke
Test weighted score 169.60, ODI weighted scored 26.71, Total 196.31
There has been a slight change in methodology in this year's Statsguru Awards, with the Test average and the ODI index score (average multiplied by strike rate) being weighted against the runs scored in each format. That was to ensure that a batsman who scored more runs in a format got a higher score than a player who scored fewer runs at the same average.
In 2012, the batsman who soared above everyone else - statistically at least - was clearly Michael Clarke. Hashim Amla played a few sublime innings, including a triple-century, while Alastair Cook, Shivnarine Chanderpaul and Jacques Kallis were others who scored consistently but without achieving the kind of numbers Clarke did. The Australian captain had four Test scores of 200 or more in 2012, a feat no batsman has ever achieved in international cricket. That in itself shows how awesome his form was in the year. Overall he averaged 106.33 in Tests, and 44.69 at a strike rate of 82.29 in ODIs. He scored 1595 runs in Tests and 581 in ODIs. Weighting that for runs scored (against a norm of 1000 for Tests and 800 for ODIs), Clarke's weighted scores read 169.60 in Tests and 26.71 in ODIs, a total of 196.31. Amla and AB de Villiers were the others who had a total score of more than 140.
Bowler of the year
(cut-off: 30 wickets in Tests, 20 in ODIs)
(cut-off: 30 wickets in Tests, 20 in ODIs)
Saeed Ajmal
Test weighted score 21.09, ODI weighted score 14.23, Total 35.32
The year 2012 was one in which most bowlers did well in one format but not the other. Among the top seven wicket-takers in ODIs, only one - Saeed Ajmal - also took more than 20 wickets in Tests. Similarly Rangana Herath and Graeme Swann, the two leading wicket-takers in Tests, took 14 and 8 ODI wickets.
Ajmal, on the other hand, was superb in both formats, taking 39 Test wickets at 20.56, and 31 ODI ones at 20.09, and an economy rate of 4.39. The only other bowler who took 20 or more wickets in ODIs and 30 or more in Tests was Morne Morkel (38 wickets at 30.28 in Tests, and 20 at 21.15 in ODIs). When normalised for 30 wickets in ODIs and 40 for Tests, Ajmal came out on top with a cumulative score of 35.32.
Best Test batsman
(cut-off: 800 runs)
(cut-off: 800 runs)
Michael Clarke - 1595 runs at 106.33, weighted score 169.60
Clarke scored 346 more Test runs than the next-best batsman - Cook - in 2012, but more stunning was the rate at which he scored them. In 18 innings he had five centuries, including four 200-plus knocks. His average and aggregate were well clear of any other batsman in 2012. Weighting his average by the runs scored (against a norm of 1000), his Test score comes to 169.60. The next-best is Hashim Amla, who scored 1064 runs at 70.93, including an unbeaten 311 against England, the second-highest score of the year. His batting score for the year was 75.47.
Clarke scored 346 more Test runs than the next-best batsman - Cook - in 2012, but more stunning was the rate at which he scored them. In 18 innings he had five centuries, including four 200-plus knocks. His average and aggregate were well clear of any other batsman in 2012. Weighting his average by the runs scored (against a norm of 1000), his Test score comes to 169.60. The next-best is Hashim Amla, who scored 1064 runs at 70.93, including an unbeaten 311 against England, the second-highest score of the year. His batting score for the year was 75.47.
Most consistent Test batsman
(cut-off: 800 runs)
(cut-off: 800 runs)
Shivnarine Chanderpaul - Consistency index 1.75
Clarke scored more Test runs than any other batsman in 2012, but for consistency there was no beating Chanderpaul, whose Test scores in 2012 read: 103, 12, 94, 68, 69, 87, 91, 46, 11, 0, 9, 43, 203, 1, 150. In 15 innings he had eight scores of 50 or more; Clarke had as many 50-plus scores in 18 innings, though he obviously made much bigger scores. Chanderpaul's relative lack of failures meant his standard deviation - which is a measure of the average distance from the mean - was a comparatively low 56.42. That, combined with his average of 98.70, gave him a consistency index (average divided by standard deviation) of 1.75, which was the best among all batsmen who scored 800-plus Test runs in 2012. Clarke had a higher average of 106.33, but his standard deviation was also relatively high (95.70), giving him an index of 1.11.
Clarke scored more Test runs than any other batsman in 2012, but for consistency there was no beating Chanderpaul, whose Test scores in 2012 read: 103, 12, 94, 68, 69, 87, 91, 46, 11, 0, 9, 43, 203, 1, 150. In 15 innings he had eight scores of 50 or more; Clarke had as many 50-plus scores in 18 innings, though he obviously made much bigger scores. Chanderpaul's relative lack of failures meant his standard deviation - which is a measure of the average distance from the mean - was a comparatively low 56.42. That, combined with his average of 98.70, gave him a consistency index (average divided by standard deviation) of 1.75, which was the best among all batsmen who scored 800-plus Test runs in 2012. Clarke had a higher average of 106.33, but his standard deviation was also relatively high (95.70), giving him an index of 1.11.
Best Test bowler
(cut-off: 30 wickets)
(cut-off: 30 wickets)
Rangana Herath - 60 wickets, average 23.61, weighted score 15.74
In 2012, Herath emerged from Muttiah Muralitharan's shadow and established himself as one of the best spinners in the game today (and clearly the best left-arm spinner around). In ten Tests he took 60 wickets at 23.61, with an excellent strike rate of a wicket every nine overs. There were a few other bowlers who had slightly better averages (Vernon Philander, Peter Siddle, Kemar Roach and Ajmal all had lower averages), but Herath also took 60 wickets, more than any other bowler. When weighted against a norm of 40 wickets for the year, Herath's bowling score drops to 15.74, better than Philander's 20.29, Ajmal's 21.09 and Siddle's 22.53.
In 2012, Herath emerged from Muttiah Muralitharan's shadow and established himself as one of the best spinners in the game today (and clearly the best left-arm spinner around). In ten Tests he took 60 wickets at 23.61, with an excellent strike rate of a wicket every nine overs. There were a few other bowlers who had slightly better averages (Vernon Philander, Peter Siddle, Kemar Roach and Ajmal all had lower averages), but Herath also took 60 wickets, more than any other bowler. When weighted against a norm of 40 wickets for the year, Herath's bowling score drops to 15.74, better than Philander's 20.29, Ajmal's 21.09 and Siddle's 22.53.
Best ODI batsman
(cut-off: 500 runs)
(cut-off: 500 runs)
AB de Villiers - ODI batting index 62.03
De Villiers played only 12 ODI innings in 2012, but he made them count: only once was he dismissed for less than 20, he topped 50 five times, and he averaged 107.50 at a strike rate of 108.58. The fact that he played fewer matches and scored only 645 runs went against him, and brought his overall score down from 116.72 (average multiplied by runs scored per ball) to 94.11 (dividing his runs scored by 800, and multiplying that factor by his original score of 116.72). Virat Kohli was the one batsman who came close to those numbers, averaging 68.40 at a strike rate of 93.78. The fact that he also scored 1026 runs helped push his overall score to 82.27. Amla had a superb ODI year too, averaging 84.75 at a strike rate of 90.76, but he played only nine innings, scoring 678 runs.
De Villiers played only 12 ODI innings in 2012, but he made them count: only once was he dismissed for less than 20, he topped 50 five times, and he averaged 107.50 at a strike rate of 108.58. The fact that he played fewer matches and scored only 645 runs went against him, and brought his overall score down from 116.72 (average multiplied by runs scored per ball) to 94.11 (dividing his runs scored by 800, and multiplying that factor by his original score of 116.72). Virat Kohli was the one batsman who came close to those numbers, averaging 68.40 at a strike rate of 93.78. The fact that he also scored 1026 runs helped push his overall score to 82.27. Amla had a superb ODI year too, averaging 84.75 at a strike rate of 90.76, but he played only nine innings, scoring 678 runs.
Best ODI bowler
(cut-off: 20 wickets)
(cut-off: 20 wickets)
Sunil Narine - ODI bowling index 9.49
Sunil Narine's 34 wickets - the second-highest in ODIs in 2012 - came at an average of 17.64, and an economy rate of 3.66. Multiplying his average by runs conceded per ball gave him a score of 10.76; normalising that by a factor of 30 wickets (so that bowlers who performed well over more matches are suitably rewarded) further improved his score to 9.49 (since he had taken 34 wickets). Ajmal came in next, with a score of 14.23. Lasith Malinga was the leading ODI wicket-taker in 2012, but he only averaged 32.08, at an economy rate of 5.66 - his overall score was 19.32.
Sunil Narine's 34 wickets - the second-highest in ODIs in 2012 - came at an average of 17.64, and an economy rate of 3.66. Multiplying his average by runs conceded per ball gave him a score of 10.76; normalising that by a factor of 30 wickets (so that bowlers who performed well over more matches are suitably rewarded) further improved his score to 9.49 (since he had taken 34 wickets). Ajmal came in next, with a score of 14.23. Lasith Malinga was the leading ODI wicket-taker in 2012, but he only averaged 32.08, at an economy rate of 5.66 - his overall score was 19.32.
****
Other awards
Test batting
(Cut-off: 800 runs, unless mentioned otherwise)
(Cut-off: 800 runs, unless mentioned otherwise)
Batting pair of the year: openers
(Cut-off: ten innings)
(Cut-off: ten innings)
Ed Cowan and David Warner
There were five opening pairs who batted together in more than ten innings, but only one of those had a partnership average of more than 40: in 18 innings, Ed Cowan and David Warner put together 886 runs at 49.22, with two century stands and a 95 in their last partnership of the year, against Sri Lanka in the Boxing Day Test. The next-best average belonged to Mohammad Hafeez and Taufeeq Umar - 39.18 in 12 innings. The disappointing pair of the year was England's Alastair Cook and Andrew Strauss: in 20 innings they averaged 28.20, with only one century stand.
There were five opening pairs who batted together in more than ten innings, but only one of those had a partnership average of more than 40: in 18 innings, Ed Cowan and David Warner put together 886 runs at 49.22, with two century stands and a 95 in their last partnership of the year, against Sri Lanka in the Boxing Day Test. The next-best average belonged to Mohammad Hafeez and Taufeeq Umar - 39.18 in 12 innings. The disappointing pair of the year was England's Alastair Cook and Andrew Strauss: in 20 innings they averaged 28.20, with only one century stand.
Batting pair of the year: others
(Cut-off: ten innings)
(Cut-off: ten innings)
Michael Clarke and Michael Hussey
In 14 innings Clarke and Hussey put together 1249 runs at an average of 104.08, with four century partnerships, of which three were over 200. They were the only pair to add 1000-plus Test runs in 2012. Clarke's form was so rich that he was also a part of the second-most prolific pair (in terms of runs scored) - with Ricky Ponting he added 894 runs in nine innings. The pair that disappointed the most this season, though, was Kumar Sangakkara and Mahela Jayawardene: in 14 innings they put together 323 runs at an average of 24.84, with only one century stand.
In 14 innings Clarke and Hussey put together 1249 runs at an average of 104.08, with four century partnerships, of which three were over 200. They were the only pair to add 1000-plus Test runs in 2012. Clarke's form was so rich that he was also a part of the second-most prolific pair (in terms of runs scored) - with Ricky Ponting he added 894 runs in nine innings. The pair that disappointed the most this season, though, was Kumar Sangakkara and Mahela Jayawardene: in 14 innings they put together 323 runs at an average of 24.84, with only one century stand.
Highest percentage of runs
Michael Clarke
Clarke's outstanding year meant his contribution to the total runs scored by Australia was much greater than that of any other player for any other team. Clarke's 1595 runs constituted 24.50% of Australia's total runs scored in 2012. The next-best was Azhar Ali, who scored 18.71% of Pakistan's runs (551 out of 2945), while Chanderpaul was third at 17.99% (987 out of 5485).
Clarke's outstanding year meant his contribution to the total runs scored by Australia was much greater than that of any other player for any other team. Clarke's 1595 runs constituted 24.50% of Australia's total runs scored in 2012. The next-best was Azhar Ali, who scored 18.71% of Pakistan's runs (551 out of 2945), while Chanderpaul was third at 17.99% (987 out of 5485).
Most runs in wins
Michael Clarke
Clarke took this one too, scoring 959 runs in wins at an average of 106.55. In 11 innings he scored three centuries - including a triple and a double - and three fifties. Amla followed, with 730 runs at 121.67, including a triple and two other centuries.
Clarke took this one too, scoring 959 runs in wins at an average of 106.55. In 11 innings he scored three centuries - including a triple and a double - and three fifties. Amla followed, with 730 runs at 121.67, including a triple and two other centuries.
Best strike rate
Michael Clarke
Clarke won this one as well. Among those who scored 800 runs, his strike rate of 65.96 runs per 100 balls was marginally better than Kevin Pietersen's 65.12. Amla came in third, with a rate of 58.91.
Clarke won this one as well. Among those who scored 800 runs, his strike rate of 65.96 runs per 100 balls was marginally better than Kevin Pietersen's 65.12. Amla came in third, with a rate of 58.91.
Highest percentage of runs in boundaries
Kevin Pietersen
Out of the 1053 runs that Pietersen scored in Tests in 2012, 634 were in boundaries (133 fours, 17 sixes). That converts to a percentage of 60.21, which was the highest among all batsmen who scored at least 800. Pietersen's 17 sixes was easily the highest among all batsmen in the year - the second-highest was Darren Sammy with 12. In terms of percentages, Marlon Samuels' 58.89 was the second-highest for runs in boundaries - he had 111 fours and 11 sixes, out of his total of 866 runs.
Out of the 1053 runs that Pietersen scored in Tests in 2012, 634 were in boundaries (133 fours, 17 sixes). That converts to a percentage of 60.21, which was the highest among all batsmen who scored at least 800. Pietersen's 17 sixes was easily the highest among all batsmen in the year - the second-highest was Darren Sammy with 12. In terms of percentages, Marlon Samuels' 58.89 was the second-highest for runs in boundaries - he had 111 fours and 11 sixes, out of his total of 866 runs.
Test bowling
(cut-off: 30 wickets)
(cut-off: 30 wickets)
Best strike rate
Kemar Roach
Roach's 39 wickets came at a superb strike rate of 41 balls per wicket, the best among those who took at least 30 Test wickets in 2012. The next-best was Vernon Philander, with a rate of 45.8 balls per wicket. Ajmal and Siddle were the others with strike rates of less than 50 (46.4 and 47.3).
Roach's 39 wickets came at a superb strike rate of 41 balls per wicket, the best among those who took at least 30 Test wickets in 2012. The next-best was Vernon Philander, with a rate of 45.8 balls per wicket. Ajmal and Siddle were the others with strike rates of less than 50 (46.4 and 47.3).
Best third- and fourth-innings bowler
(cut-off: 15 wickets)
(cut-off: 15 wickets)
Vernon Philander
For the second year running, Philander had the best bowling average in the opposition's second innings (with a 15-wicket cut-off). His 19 wickets came at an average of 14.84; last year he had averaged 8.93. Roach took as many wickets as Philander, and averaged 15.57. Ajmal averaged 16.37, Herath 19.62, and Hilfenhaus 19.88.
For the second year running, Philander had the best bowling average in the opposition's second innings (with a 15-wicket cut-off). His 19 wickets came at an average of 14.84; last year he had averaged 8.93. Roach took as many wickets as Philander, and averaged 15.57. Ajmal averaged 16.37, Herath 19.62, and Hilfenhaus 19.88.
ODI batting
(cut-off: 500 runs against the top sides, unless mentioned otherwise)
(cut-off: 500 runs against the top sides, unless mentioned otherwise)
Best scoring rate
AB de Villiers
Among batsmen who scored at least 500 ODI runs (against the Test-playing teams only), de Villiers was the only one who scored at faster than a run a ball. He racked up 645 runs in 594 balls, a scoring rate of 108.58 runs per 100 balls. The next-best was Kohli (93.78), while three other batsmen - Angelo Mathews, David Hussey and Hashim Amla - also scored 500-plus runs at a scoring rate of more than 90.
Among batsmen who scored at least 500 ODI runs (against the Test-playing teams only), de Villiers was the only one who scored at faster than a run a ball. He racked up 645 runs in 594 balls, a scoring rate of 108.58 runs per 100 balls. The next-best was Kohli (93.78), while three other batsmen - Angelo Mathews, David Hussey and Hashim Amla - also scored 500-plus runs at a scoring rate of more than 90.
Lowest scoring rate
Dinesh Chandimal
Chandimal was the only batsman who scored 500-plus ODI runs against the Test-playing sides at a strike rate of less than 75 (845 runs in 1136 balls, strike rate 74.38). A couple of other Sri Lankan batsmen barely made it beyond 75 - Lahiru Thirimanne (75.03) and Upul Tharanga (75.73).
Chandimal was the only batsman who scored 500-plus ODI runs against the Test-playing sides at a strike rate of less than 75 (845 runs in 1136 balls, strike rate 74.38). A couple of other Sri Lankan batsmen barely made it beyond 75 - Lahiru Thirimanne (75.03) and Upul Tharanga (75.73).
Batting pair of the year: openers
(cut-off: minimum eight innings)
(cut-off: minimum eight innings)
Mohammad Hafeez and Nasir Jamshed
They batted together only eight times, but they made those partnerships count, scoring 619 runs at an average of 77.37 and a run rate of 5.19 runs per over. In those eight stands, they put together three century partnerships, including one of 224 runs. Multiplying their average stand by the runs scored per ball gave them a partnership index of 66.93. The only other pair who averaged more than 50 was the Sri Lankan one of Tillakaratne Dilshan and Mahela Jayawardene - 615 runs in 12 innings at 51.25, and a run-rate of 5.89, giving them an index of 50.31.
They batted together only eight times, but they made those partnerships count, scoring 619 runs at an average of 77.37 and a run rate of 5.19 runs per over. In those eight stands, they put together three century partnerships, including one of 224 runs. Multiplying their average stand by the runs scored per ball gave them a partnership index of 66.93. The only other pair who averaged more than 50 was the Sri Lankan one of Tillakaratne Dilshan and Mahela Jayawardene - 615 runs in 12 innings at 51.25, and a run-rate of 5.89, giving them an index of 50.31.
Batting pair of the year: others
(cut-off: minimum eight innings)
(cut-off: minimum eight innings)
MS Dhoni and Suresh Raina
The Indian pair of Dhoni and Raina scored 367 partnership runs in eight innings at an average of 61.16 and a run rate of 5.28 per over. That gave them an index of 53.82. The two other close contenders were Kohli-Gambhir (614 runs at an average of 55.81 and a run rate of 5.24, for an index of 48.74), and Jayawardene-Sangakkara (462 runs at 51.33 and 5.68, for an index of 48.59).
The Indian pair of Dhoni and Raina scored 367 partnership runs in eight innings at an average of 61.16 and a run rate of 5.28 per over. That gave them an index of 53.82. The two other close contenders were Kohli-Gambhir (614 runs at an average of 55.81 and a run rate of 5.24, for an index of 48.74), and Jayawardene-Sangakkara (462 runs at 51.33 and 5.68, for an index of 48.59).
Highest percentage of runs in boundaries
David Warner
Warner struck 84 fours and ten sixes in the 816 ODI runs he scored, which means 396 of his runs came in fours and sixes, a percentage of 48.53. Close on his heels was Ian Bell, who scored 48.45% of his runs in boundaries.
Warner struck 84 fours and ten sixes in the 816 ODI runs he scored, which means 396 of his runs came in fours and sixes, a percentage of 48.53. Close on his heels was Ian Bell, who scored 48.45% of his runs in boundaries.
Lowest dot-ball percentage
AB de Villiers
Of the 594 balls de Villiers faced, only 220 were dot balls, a percentage of 37.04. He was the only batsman with a dot-ball percentage of less than 40. The next-best was Mathews (40.41), while Kohli (43.60) and David Hussey (44.74) were the others with dot-ball percentages of less than 45.
Of the 594 balls de Villiers faced, only 220 were dot balls, a percentage of 37.04. He was the only batsman with a dot-ball percentage of less than 40. The next-best was Mathews (40.41), while Kohli (43.60) and David Hussey (44.74) were the others with dot-ball percentages of less than 45.
Highest percentage of team runs
Virat Kohli
Sangakkara was the highest run-scorer in ODIs in 2012, but Kohli's 1026 runs was 24.24% of the total runs that India scored in the year (4232). There were two South Africans who also scored a higher percentage of team runs than Sangakkara: Amla scored 23.18% of South Africa's 2925 runs, while de Villiers contributed 22.05.
Sangakkara was the highest run-scorer in ODIs in 2012, but Kohli's 1026 runs was 24.24% of the total runs that India scored in the year (4232). There were two South Africans who also scored a higher percentage of team runs than Sangakkara: Amla scored 23.18% of South Africa's 2925 runs, while de Villiers contributed 22.05.
Most runs in wins
Virat Kohli
Kohli was ahead on this parameter too, scoring more runs in wins (814), and at a higher average (116.28) and strike rate (100.74) than any other batsman who scored at least 400 runs in wins. Amla's numbers were the next-best: 590 runs in wins at an average of 98.33 and a strike rate of 94.70.
Kohli was ahead on this parameter too, scoring more runs in wins (814), and at a higher average (116.28) and strike rate (100.74) than any other batsman who scored at least 400 runs in wins. Amla's numbers were the next-best: 590 runs in wins at an average of 98.33 and a strike rate of 94.70.
Most runs in chases
Virat Kohli
Kohli snapped up this one as well, scoring 722 runs in chases, at an average of 80.22 and a strike rate of 98.36. Sangakkara was next-best in terms of runs while chasing a target, scoring 630 at 48.46 and a strike rate of 85.02.
Kohli snapped up this one as well, scoring 722 runs in chases, at an average of 80.22 and a strike rate of 98.36. Sangakkara was next-best in terms of runs while chasing a target, scoring 630 at 48.46 and a strike rate of 85.02.
ODI bowling
(cut-off: min 120 overs)
(cut-off: min 120 overs)
Best economy rate
Mohammad Hafeez
For the second year running, Hafeez was the most difficult bowler to get away: in 2011 his economy rate was 3.43; this time it went up slightly, to 3.57, but it was still the best among bowlers who bowled at least 120 overs. The only other bowler with an economy rate of less than four was Narine (3.66).
For the second year running, Hafeez was the most difficult bowler to get away: in 2011 his economy rate was 3.43; this time it went up slightly, to 3.57, but it was still the best among bowlers who bowled at least 120 overs. The only other bowler with an economy rate of less than four was Narine (3.66).
Worst economy rate
Thisara Perera
Perera took 32 wickets in 21 matches, but his economy rate of 5.95 runs per over was the poorest among bowlers who bowled 120 overs. Next in line was also a Sri Lankan: Lasith Malinga managed an economy rate of 5.66, though he was also among the wickets, taking 47 in 31 innings.
Perera took 32 wickets in 21 matches, but his economy rate of 5.95 runs per over was the poorest among bowlers who bowled 120 overs. Next in line was also a Sri Lankan: Lasith Malinga managed an economy rate of 5.66, though he was also among the wickets, taking 47 in 31 innings.
Best dot-ball percentage
Sunil Narine
Narine was the only bowler who sent down 120 or more overs and achieved a dot-ball percentage of more than 60. Of the 983 balls he bowled, 64.70% were dots. The next-best was Nuwan Kulasekara, with a dot-ball percentage of 57.94.
Narine was the only bowler who sent down 120 or more overs and achieved a dot-ball percentage of more than 60. Of the 983 balls he bowled, 64.70% were dots. The next-best was Nuwan Kulasekara, with a dot-ball percentage of 57.94.
Lowest boundary percentage
Mohammad Hafeez
For the second year in a row, Hafeez won this one, conceding only 21 fours and five sixes in 882 balls, a percentage of 2.95. Next in line was Herath, with a percentage of 3.80. The top five positions were all taken by spinners - R Ashwin, Shahid Afridi and Narine taking the next three - which isn't surprising, considering spinners usually bowl most of their overs in the middle of the innings, when the field is spread out and batmen are unwilling to take risks. However, considering that Hafeez often bowls at the start of an innings, his stats are all the more creditable.
For the second year in a row, Hafeez won this one, conceding only 21 fours and five sixes in 882 balls, a percentage of 2.95. Next in line was Herath, with a percentage of 3.80. The top five positions were all taken by spinners - R Ashwin, Shahid Afridi and Narine taking the next three - which isn't surprising, considering spinners usually bowl most of their overs in the middle of the innings, when the field is spread out and batmen are unwilling to take risks. However, considering that Hafeez often bowls at the start of an innings, his stats are all the more creditable.
T20Is
Best batsman
(cut-off: 250 balls faced)
(cut-off: 250 balls faced)
Chris Gayle
In ten innings in T20 internationals in 2012, Gayle went past 50 five times - outstanding consistency in a format in which batsmen struggle to string together substantial scores consistently. He averaged 46 in the year, at a strike rate of 144.88. Multiplying the average by the runs scored per ball (with a 1.1 weightage for the run rate, given the format), Gayle arrived at a score of 109.61. The only one who ran him close was Martin Guptill, who was one of only four batsmen to score a century in the format in 2012. Guptill averaged 47.20 in 13 innings, but his strike rate of 130.74 was lower than Gayle's 144.88. Also, with the slightly higher weight for run rate, Guptill's overall score dropped to 100.46.
In ten innings in T20 internationals in 2012, Gayle went past 50 five times - outstanding consistency in a format in which batsmen struggle to string together substantial scores consistently. He averaged 46 in the year, at a strike rate of 144.88. Multiplying the average by the runs scored per ball (with a 1.1 weightage for the run rate, given the format), Gayle arrived at a score of 109.61. The only one who ran him close was Martin Guptill, who was one of only four batsmen to score a century in the format in 2012. Guptill averaged 47.20 in 13 innings, but his strike rate of 130.74 was lower than Gayle's 144.88. Also, with the slightly higher weight for run rate, Guptill's overall score dropped to 100.46.
Best bowler
(cut-off: 40 overs)
Graeme Swann
This one was a battle between two offspinners, Swann and Ajmal. Swann edged ahead in terms of both average and economy rate, averaging 15.20 and conceding 5.7 per over, to Ajmal's average of 15.64 and 6.1 runs per over. In the 11 matches he played and bowled in, only three times did he go at more than seven runs per over.
This one was a battle between two offspinners, Swann and Ajmal. Swann edged ahead in terms of both average and economy rate, averaging 15.20 and conceding 5.7 per over, to Ajmal's average of 15.64 and 6.1 runs per over. In the 11 matches he played and bowled in, only three times did he go at more than seven runs per over.
Best batting pair
(cut-off: five partnerships)
(cut-off: five partnerships)
Michael Hussey and Shane Watson
In five partnerships in T20Is in 2012, Hussey and Watson put together 108, 39, 70*, 99 and 20 - 336 runs at an average of 84, and a run rate of 9.00 per over. Kohli and Yuvraj Singh also did pretty well, averaging 46.25 at a run rate of 8. 67, but they weren't quite as good as the Australian pair.
In five partnerships in T20Is in 2012, Hussey and Watson put together 108, 39, 70*, 99 and 20 - 336 runs at an average of 84, and a run rate of 9.00 per over. Kohli and Yuvraj Singh also did pretty well, averaging 46.25 at a run rate of 8. 67, but they weren't quite as good as the Australian pair.
Team
Most dominant: Tests
South Africa
South Africa and Australia were the two dominant Test sides of 2012: South Africa won five out of ten, compared to Australia's seven out of 11. However, South Africa didn't lose a single Test, while Australia lost a crucial one to South Africa in Perth, a result that ended their hopes of immediately taking over the No. 1 spot. South Africa also did much better overseas, winning series in Australia, England and New Zealand, while five of Australia's seven wins were at home.
South Africa and Australia were the two dominant Test sides of 2012: South Africa won five out of ten, compared to Australia's seven out of 11. However, South Africa didn't lose a single Test, while Australia lost a crucial one to South Africa in Perth, a result that ended their hopes of immediately taking over the No. 1 spot. South Africa also did much better overseas, winning series in Australia, England and New Zealand, while five of Australia's seven wins were at home.
Most dominant: ODIs
England
England didn't have a great year in Tests, but they nailed it in ODIs, winning 12 out of 15 matches, and losing just two. They started the year with four wins against Pakistan in the UAE, and then also beat Australia four times at home. Their only losses were to South Africa at home, in a series they tied 2-2. The next-best win-loss record was South Africa's - 8-4 in 12 games.
England didn't have a great year in Tests, but they nailed it in ODIs, winning 12 out of 15 matches, and losing just two. They started the year with four wins against Pakistan in the UAE, and then also beat Australia four times at home. Their only losses were to South Africa at home, in a series they tied 2-2. The next-best win-loss record was South Africa's - 8-4 in 12 games.
Most disciplined: ODIs
England
The best ODI team of 2012 also had the most disciplined bowlers. England conceded only 76 runs in wides and no-balls in 15 ODIs, an average of 5.07 per match. It was the lowest among all sides - the next-lowest was Sri Lanka, averaging 6. At the other end of the scale were West Indies, who conceded 10.76 per match, and Bangladesh (10.33).
The best ODI team of 2012 also had the most disciplined bowlers. England conceded only 76 runs in wides and no-balls in 15 ODIs, an average of 5.07 per match. It was the lowest among all sides - the next-lowest was Sri Lanka, averaging 6. At the other end of the scale were West Indies, who conceded 10.76 per match, and Bangladesh (10.33).
Most dominant: T20Is
West Indies
The winners of the 2012 World Twenty20 were also the most dominant team in the format last year, achieving a win-loss ratio of 1.75, slightly better than South Africa's 1.33. Apart from the World Twenty20, in which they won three games and lost two, West Indies also had a 2-0 series win against New Zealand in Lauderhill.
The winners of the 2012 World Twenty20 were also the most dominant team in the format last year, achieving a win-loss ratio of 1.75, slightly better than South Africa's 1.33. Apart from the World Twenty20, in which they won three games and lost two, West Indies also had a 2-0 series win against New Zealand in Lauderhill.
All ODI and T20I stats include only performances against Test-playing sides only.
S Rajesh is stats editor of ESPNcricinfo. Follow him on Twitter