Pakistan's pace problems in Australia
Pakistan's fast bowlers have traditionally been the biggest weapons for their team, but in Australia their numbers aren't so impressive, especially recently
S Rajesh
Dec 16, 2016, 5:09 AM
Pakistan's fast bowlers have averaged 45.94 in Tests in Australia since January 1999, their worst in any country during this period • ESPNcricinfo Ltd
One of the biggest strengths for Pakistan in their Test history has been their pace attack. In almost any era, they have had two world-class fast bowlers in their line-up, with the support cast being more than adequate as well. These bowlers have had the skills to conquer most conditions, whether they be the seamer-friendly conditions of England and New Zealand, or the dry pitches of the subcontinent. However, the one country where they haven't always worked their magic is Australia: in all Tests in Australia, Pakistan's fast bowlers have averaged 38.54, which is their poorest among all countries. Their overall average in all countries is 30.49, which means their performance in Australia is about 26% poorer than their overall numbers.
| Host Country | Tests | Wickets | Average | Strike rate |
| Australia | 32 | 282 | 38.54 | 75.6 |
| South Africa | 12 | 107 | 36.18 | 63.1 |
| India | 33 | 241 | 35.42 | 75.4 |
| U.A.E. | 28 | 191 | 33.47 | 64.5 |
| West Indies | 23 | 208 | 32.88 | 62.9 |
| England | 53 | 499 | 30.71 | 62.4 |
| Sri Lanka | 24 | 193 | 30.69 | 57.9 |
| New Zealand | 31 | 335 | 28.36 | 60.4 |
| Pakistan | 151 | 1263 | 27.72 | 60.1 |
| Zimbabwe | 10 | 123 | 24.58 | 54.7 |
| Bangladesh | 7 | 57 | 24.19 | 42.2 |
The numbers have especially nosedived over the last three series that Pakistan have played in Australia: they have lost each of nine Tests in these series, and the relative lack of success for the fast bowlers has played a big part in these results.
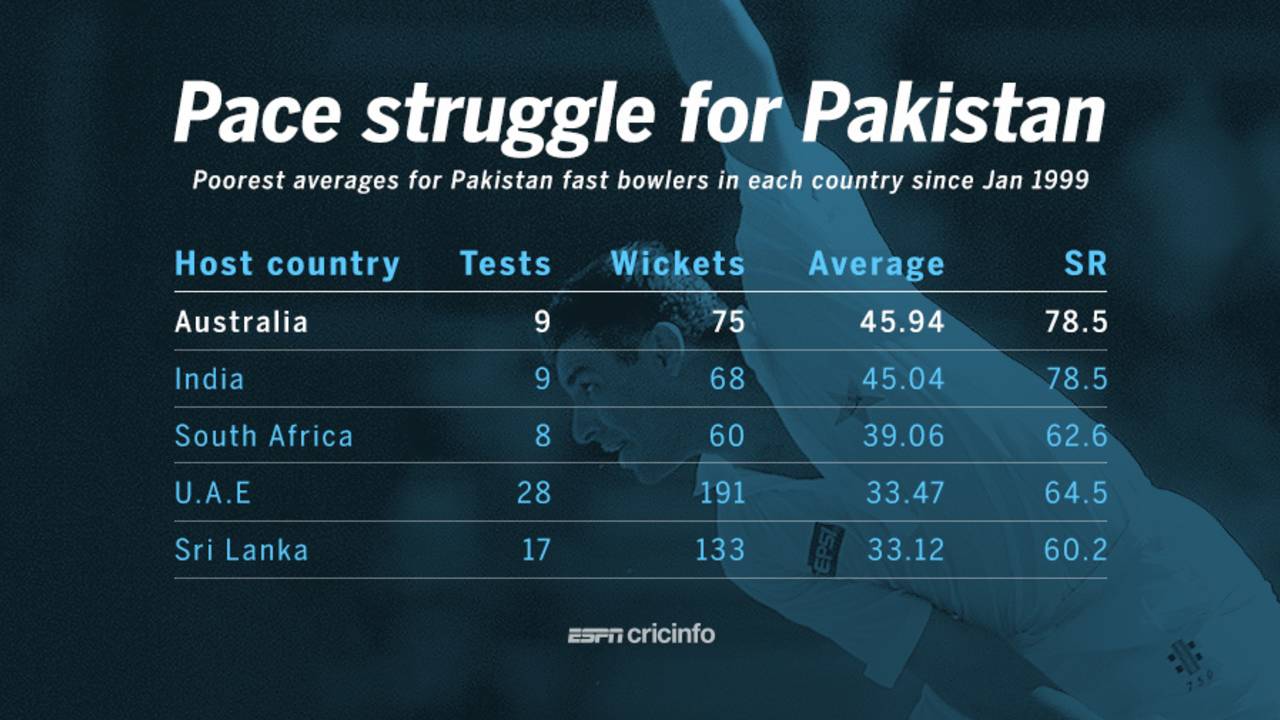
Any analysis of Pakistan's bowling performances must also factor in a few dropped catches, which can sometimes make a huge difference to the bowling averages, but even so, the numbers don't paint a pretty picture for Pakistan's pace attack: in the last nine Tests in Australia, they have conceded nearly 46 runs per wicket, which, again, is their worst in any country in the last 18 years. They also haven't done so well in South Africa, averaging 39.06, which suggests they tend to struggle on pitches which offer more bounce. In all countries other than Australia, India and South Africa, they have conceded fewer than 34 runs per wicket.
| Host Country | Tests | Wickets | Average | Strike rate |
| Australia | 9 | 75 | 45.94 | 75.0 |
| India | 9 | 68 | 45.04 | 78.5 |
| South Africa | 8 | 60 | 39.06 | 62.6 |
| U.A.E. | 28 | 191 | 33.47 | 64.5 |
| Sri Lanka | 17 | 133 | 33.12 | 60.2 |
| Pakistan | 33 | 300 | 32.83 | 58.8 |
| England | 16 | 182 | 32.26 | 57.0 |
| New Zealand | 12 | 137 | 30.66 | 59.3 |
| West Indies | 7 | 51 | 29.76 | 59.1 |
| Zimbabwe | 5 | 52 | 24.67 | 52.5 |
| Bangladesh | 7 | 57 | 24.19 | 42.2 |
A look at the stats of some of the top Pakistan fast bowlers overall and in Australia reveals significant difference in the averages, especially for the two bowlers who were arguably the fastest of the lot. Shoaib Akhtar took only 17 wickets in six Tests in Australia and averaged 43.52, while Waqar Younis, in seven Tests, had 14 wickets at 40.50. Both did far better when not playing in Australia - they had career averages in the 20s - and the difference in averages for them was more than 16.
The numbers aren't as skewed for the rest, though most of them have done better outside Australia. Imran Khan had a career average of 22.81, and while his numbers in Australia were pretty impressive too - he averaged 28.51 - it was still his poorest average in any country.
The two bowlers who did as well or better in Australia, compared to their career numbers, were Wasim Akram and Sarfraz Nawaz. Akram played three series in Australia, and was outstanding in two of them: in 1989-90, he took 17 wickets in three Tests at 18.70, and in 1995-96 he nabbed 14 wickets at 19.50. He was past his prime by the time the 1999-2000 series came along, but his overall average in Australia is still an impressive 24.05.
Sarfraz's single defining bowling performance came in Australia, when he destroyed them in Melbourne, taking 9 for 86 in a matchwinning performance in 1979. He didn't take another five-wicket haul in Australia, but he was consistently among the wickets, and remains the only Pakistan bowler to take 50 Test wickets in Australia.
Australia's batsmen have always been among the better players of fast bowling, especially in terms of back-foot play on bouncy pitches. Also, conditions in Australia don't usually support swing bowling, so it isn't surprising that Pakistan's pace attack haven't been as successful here as in some other parts of the world. It is surprising, though, that Pakistan have been so poor in Australia, especially recently. South Africa and England have done much better recently, while even India's fast bowlers have a marginally better average.
However, it's also true that Australia has been a pretty tough place for overseas fast bowlers over the last couple of decades. Since 1999, Australia's fast bowlers have averaged 27 in home conditions, while the other teams put together have averaged 43.57. Given Pakistan's pace pedigree over the years, though, you'd still expect them to do better than average almost 46 runs per wicket, no matter how tough the conditions.
Even with the undoubted class of Yasir Shah, Pakistan will still need better stats from their quick bowlers this time around if they are to avoid the debacle of the last three tours.
| Team | Mat | Wkts | Average | Econ | SR |
| Australia | 102 | 1297 | 27.04 | 2.96 | 54.7 |
| South Africa | 15 | 188 | 35.57 | 3.34 | 63.7 |
| England | 21 | 226 | 37.30 | 3.55 | 62.9 |
| India | 19 | 167 | 45.89 | 3.88 | 70.7 |
| Pakistan | 9 | 75 | 45.94 | 3.67 | 75.0 |
| New Zealand | 12 | 103 | 49.20 | 3.72 | 79.2 |
| West Indies | 14 | 111 | 50.12 | 3.66 | 82.0 |
| Sri Lanka | 7 | 45 | 58.64 | 3.77 | 93.1 |
| Zimbabwe | 2 | 9 | 77.77 | 4.69 | 99.3 |
| Bangladesh | 2 | 7 | 92.14 | 3.43 | 161.0 |
All stats exclude the ongoing Australia-Pakistan Test at the Gabba.
S Rajesh is stats editor of ESPNcricinfo. Follow him on Twitter.