Two fortresses called Brisbane and Centurion
Australia haven't lost at the Gabba since 1988, while South Africa have a 14-2 record in Centurion. These are easily the two most dominant home venues going around
S Rajesh
Dec 19, 2014, 5:31 AM
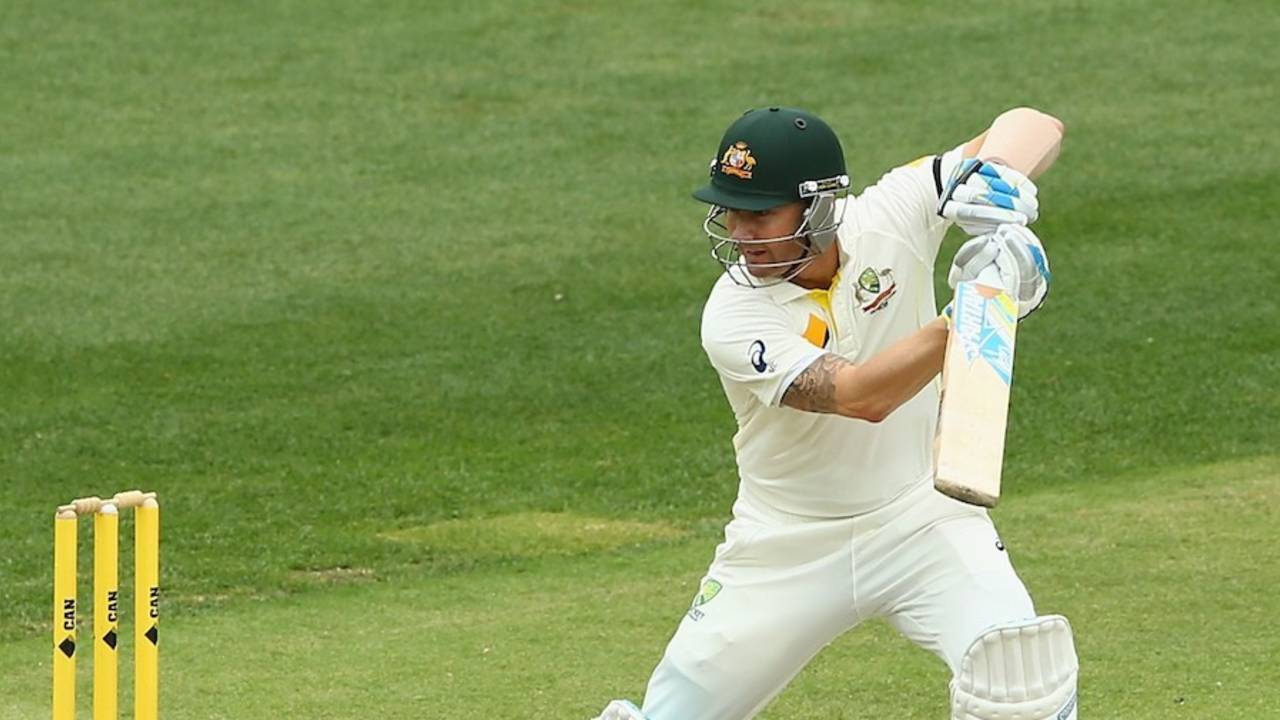
Michael Clarke has scored 1030 runs at the Gabba at an average of 103. It's one of two grounds where he has scored 1000-plus runs at a 100-plus average in Tests • Getty Images
The two Test matches being played this week are at venues that are easily the most intimidating for visiting teams over the last two-and-a-half decades. Touring sides fear the turning tracks of India and Sri Lanka, and the extreme pace and bounce of the WACA in Perth, but in terms of results, the two venues where home teams have been the most dominant, by far, are the Gabba in Brisbane and the SuperSport Park in Centurion.
It helps that the teams which play there most often are Australia and South Africa, sides that have generally been so strong that they are threats in most conditions. Even so, their records at these two venues is quite stunning. When Australia last lost a Test at the Gabba, the world was one year away from hearing about a phenomenon called Sachin Tendulkar. The Test they lost was against a West Indies side whose bowling attack included Malcolm Marshall, Patrick Patterson, Curtly Ambrose and Courtney Walsh. Since then, they have an 18-0 record in 25 Tests, with five wins each against England and New Zealand, and four against West Indies.
Similarly, South Africa have a stunning record in Centurion. They've won 14 and lost two Tests out of 19, but one of those losses was a contrived one, when both South Africa and England forfeited an innings in 2000. Their last five wins here have all been by an innings, against New Zealand, Bangladesh, India, Sri Lanka and Pakistan. However, what spoils their result sheet is their most recent result here, which was a resounding 281-run loss against Michael Clarke's Australian team earlier this year.
Further down the list, there are several teams with win-loss ratios of three to four wins per defeat at specific venues. Australia themselves feature in the table four more times, which illustrates just how dominant they've been in world cricket over the last 25 years. At each of these venues, their ratio is at least three wins per defeat.
| Team, venue | Test | W/ L | Ratio | Drawn | Bat ave | Bowl ave |
| Australia, Brisbane | 25 | 18/ 0 | - | 7 | 48.80 | 25.61 |
| South Africa, Centurion | 19 | 14/ 2 | 7.00 | 3 | 41.06 | 25.21 |
| Australia, Melbourne | 25 | 19/ 4 | 4.75 | 2 | 37.04 | 25.01 |
| Australia, Sydney | 28 | 18/ 4 | 4.50 | 6 | 39.55 | 31.10 |
| Pakistan, Karachi | 14 | 9/ 2 | 4.50 | 3 | 41.34 | 30.46 |
| South Africa, Cape Town | 27 | 18/ 4 | 4.50 | 5 | 40.78 | 28.18 |
| Australia, Adelaide | 27 | 16/ 4 | 4.00 | 7 | 43.18 | 31.06 |
| Australia, Perth | 25 | 16/ 5 | 3.20 | 4 | 40.60 | 27.21 |
| Pakistan, Lahore | 18 | 6/ 2 | 3.00 | 10 | 43.24 | 32.82 |
| Sri Lanka, SSC | 36 | 18/ 6 | 3.00 | 12 | 43.89 | 30.47 |
At each of Brisbane and Centurion, the home teams have been utterly dominant, as is reflected in their batting and averages there, and the difference between the two. Brisbane has also additionally benefitted by almost always hosting the opening Test of a series, which means visiting teams often haven't had much time to adjust to conditions: of the 25 Tests they've hosted during this period (excluding the ongoing one), 24 have been the first of the series. The only exception was in 1993-94, when Brisbane hosted the third Test of the series, against New Zealand; Australia ended up winning that Test quite emphatically anyway, by an innings and 96 runs. On the other hand, only seven out of 19 games in Centurion have been the first of the series.
At both these grounds, the home teams have found some outstanding performers, as they must to have the kind of records they do. For Australia, their captains have usually led from the front, and since this is usually the first Test of a series, early runs from the captain - plus a win for the tone - has helped set the tone perfectly for Australia in most of the series they've played here. Ricky Ponting has the highest aggregate of the lot during this period: between 2003 and 2007 these were his consecutive scores at the ground - 54, 50, 51, 149, 104*, 196, 60*, 56. In terms of averages, though, Michael Clarke is even better, with 1030 runs for only ten dismissals, giving him a mean of 103. Brisbane is one of two venues - the other is Adelaide - where Clarke has scored 1000-plus runs at a 100-plus average; he is the only batsman to do so at two grounds. Mark Taylor and Matthew Hayden haven't done badly either.
All these runs for the home captains means that Brisbane is one of the best venues for them during this period: they average, collectively, 68.03 here, with eight hundreds in 26 Tests. With a cut-off of 12 Tests, the only venue where the leader of the home team has done better is the National Stadium in Karachi, where captains average 76.88.
In Centurion, the home captains haven't been as successful collectively, averaging 48.43, but the others have taken the mantle of scoring massive runs. Jacques Kallis has scored 1267 runs at an average of 70.38, with five hundreds in 16 Tests, including an unbeaten 201 against India in 2010. AB de Villiers and Hashim Amla, who both scored hundreds in the ongoing Test against West Indies, have both been outstanding too: de Villiers has scored four hundreds in 12 Tests at SuperSport Park and averages 68.05. Since 2010, his sequence of scores here has been as follows: 129, 99, 121, 91, 48, 152. Amla's 208 in the ongoing Test has lifted his average here to 85.27; it's his highest aggregate and average at any home ground.
| Batsman | Tests | Runs | Average | 100s/ 50s |
| Ricky Ponting | 17 | 1335 | 63.57 | 4/ 10 |
| Michael Clarke | 10 | 1030 | 103.00 | 5/ 2 |
| Mark Taylor | 10 | 912 | 57.00 | 2/ 6 |
| Matthew Hayden | 9 | 901 | 60.06 | 4/ 1 |
| Batsman | Tests | Runs | Average | 100s/ 50s |
| Jacques Kallis | 16 | 1267 | 70.38 | 5/ 5 |
| AB de Villiers | 12 | 1157 | 68.05 | 4/ 5 |
| Hashim Amla | 9 | 938 | 85.27 | 4/ 4 |
Includes numbers from the ongoing Centurion Test
As with batting, both these teams have had several bowling stars at their strongest venues. Shane Warne averaged more than six wickets per Test at the Gabba, at an average that was marginally more than 20, while Glenn McGrath wasn't far behind, taking 65 wickets at 21.75. Brett Lee and Mitchell Johnson have carried on the good since then, while Craig McDermott was the go-to man before Warne and McGrath arrived.
Similarly, South Africa's top bowlers all have excellent records here, though unlike Australia they relied almost entirely on fast bowling to do all the damage. Makhaya Ntini has a career bowling average of almost 29, but at the SuperSport Park his average was an outstanding 21.22. Dale Steyn and Allan Donald both average less than 20 here, with Steyn eyeing 50 wickets at the ground. Not surprisingly, most opposition teams have struggled to cope with the firepower that Australia and South Africa have unleashed at their favourite venues.
| Bowler | Tests | Wickets | Average | SR | 5WI/ 10WM |
| Shane Warne | 11 | 68 | 20.30 | 48.8 | 3/ 2 |
| Glenn McGrath | 13 | 65 | 21.75 | 49.8 | 4/ 1 |
| Brett Lee | 6 | 29 | 21.55 | 40.9 | 2/ 0 |
| Criag McDermott | 5 | 29 | 19.06 | 43.0 | 2/ 0 |
| Mitchell Johnson | 6 | 26 | 24.19 | 44.2 | 2/ 0 |
| Bowler | Tests | Wickets | Average | SR | 5WI/ 10WM |
| Makhaya Ntini | 10 | 54 | 21.22 | 41.0 | 4/ 1 |
| Dale Steyn | 8 | 42 | 18.40 | 32.0 | 2/ 1 |
| Jacques Kallis | 16 | 31 | 27.80 | 54.4 | 0/ 0 |
| Allan Donald | 5 | 27 | 16.25 | 33.0 | 3/ 0 |
| Shaun Pollock | 10 | 27 | 26.29 | 65.0 | 0/ 0 |
S Rajesh is stats editor of ESPNcricinfo. Follow him on Twitter