Lethal at home
Makhaya Ntini was at his best when bowling in home conditions, where the pacy and bouncy pitches made him extremely tough to face
S Rajesh
03-Nov-2010
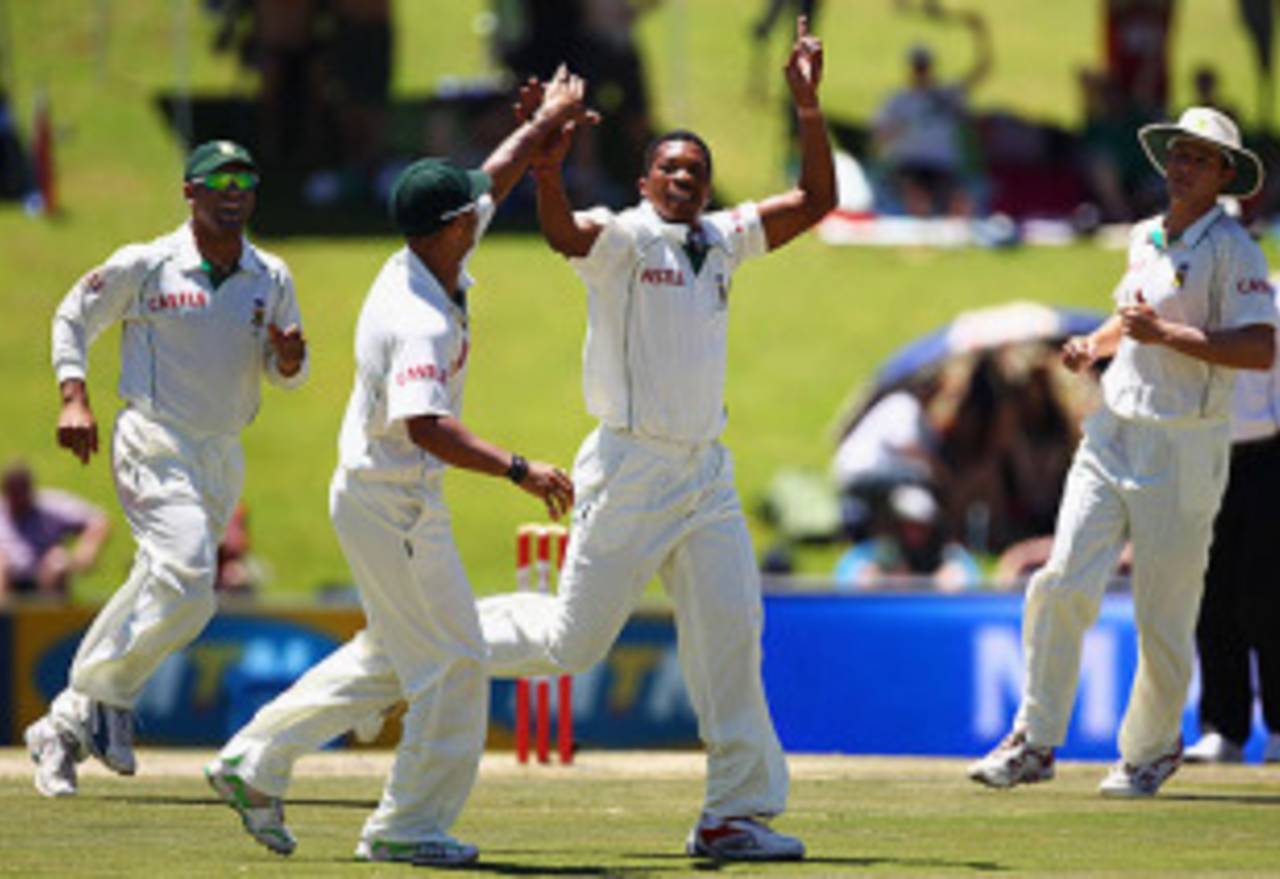
No bowler has taken as many Test wickets in South Africa as Makhaya Ntini • Getty Images
Makhaya Ntini perhaps wasn't the most complete fast bowler to emerge from South Africa, but he had several other qualities which made him one of the most valuable players for them. That only three South Africans - Jacques Kallis, Mark Boucher and Shaun Pollock - have played more Tests than him indicates his stature. His international career lasted almost 12 years, and finished with excellent numbers: he is the second-highest Test wicket-taker for South Africa, falling only ten short of the 400-wicket mark. In ODIs, his 265-wicket haul lies next only to Pollock and Allan Donald.
Ntini began his Test career with two home games against Sri Lanka, but only managed four wickets in those matches. Home Tests against New Zealand in 2000 were more profitable - in Bloemfontein he nailed his first five-for - but till the end of 2001, success in Test cricket was intermittent, as he managed only 45 wickets in his first 20 matches.
Over the next five years, though, he truly made a mark as a high-class Test bowler, averaging close to five wickets per Test, and conceding a shade over 26 runs per wicket. At Lord's in 2003, Ntini became the first South African bowler to take ten wickets in a Test at that ground, in a display that gave South Africa a comprehensive victory. A couple of years later in Port-of-Spain, Ntini finished with match figures of 13 for 132, which remain the best match figures by a South African. Both those performances won him Man-of-the-Match awards; in fact, of the six such awards he won in his Test career, five came between 2003 and 2006.
In the last three years, though, his wicket-taking ability reduced noticeably, and he struggled particularly in 2009, taking only 13 wickets in six Tests at an average of 57.
| Period | Tests | Wickets | Average | Strike rate | 5WI/ 10WM |
| Till Dec 2001 | 20 | 45 | 35.93 | 74.5 | 1/ 0 |
| Jan 2002 to Dec 2006 | 51 | 243 | 26.16 | 47.9 | 14/ 4 |
| Jan 2007 onwards | 30 | 102 | 32.03 | 57.1 | 3/ 0 |
| Career | 101 | 390 | 28.82 | 53.4 | 18/ 4 |
In ODIs too, Ntini's best years were between 2002 and 2006, when he picked up 184 wickets from 108 games at an excellent average and a strike rate of less than 30 balls per wicket. His best ODI haul came during this period, when he picked up 6 for 22 against Australia at Cape Town.
| Period | ODIs | Wickets | Average | Econ rate | Strike rate |
| Till Dec 2001 | 31 | 39 | 26.07 | 4.16 | 37.5 |
| Jan 2002 to Dec 2006 | 108 | 184 | 22.04 | 4.44 | 29.7 |
| Jan 2007 onwards | 34 | 43 | 34.53 | 5.10 | 40.5 |
| Career | 173 | 266 | 24.65 | 4.53 | 32.6 |
In 2005 and 2006 Ntini had his two greatest years in Test cricket: during this period he was the second-highest wicket-taker in the world, next only to Muttiah Muralitharan. During these two years Ntini's average was marginally better than Glenn McGrath's, and he did well against Australia too, a team which had always given him problems in the past. In five Tests he took 28 wickets versus Australia in this period, at an average of 24.61; his overall Test average against Australia was 34.74.
| Bowler | Tests | Wickets | Average | Strike rate | 5WI/ 10WM |
| Muttiah Muralitharan | 19 | 142 | 17.49 | 39.3 | 13/ 6 |
| Makhaya Ntini | 20 | 105 | 23.05 | 42.1 | 8/ 3 |
| Glenn McGrath | 18 | 80 | 23.43 | 54.9 | 4/ 0 |
| Shane Warne | 25 | 145 | 24.78 | 49.5 | 9/ 2 |
| Andrew Flintoff | 24 | 101 | 27.47 | 52.6 | 1/ 0 |
Ntini was a much greater force with the ball when bowling in the familiarity of his home conditions: in South Africa, he averaged 24.04, and took 248 wickets in 53 Tests; he played only five fewer Tests overseas, but took 108 fewer wickets, and gave away more than 37 runs per wicket. Of his 18 five-fors, 12 were taken in South Africa. In fact, he is the highest wicket-taker in South Africa, 14 clear of the Pollock.
For a bowler of his calibre, though, he was surprisingly ineffective overseas: in four countries - Australia, New Zealand, Pakistan and Sri Lanka - he played three or more Tests and had a bowling average of more than 40.
| Bowler | Tests | Wickets | Average | Strike rate | 5WI/ 10WM |
| Makhaya Ntini | 53 | 249 | 24.04 | 45.2 | 12/ 2 |
| Shaun Pollock | 59 | 235 | 21.08 | 52.5 | 9/ 1 |
| Allan Donald | 38 | 177 | 21.64 | 45.0 | 12/ 2 |
| Jacques Kallis | 74 | 148 | 29.48 | 60.2 | 2/ 0 |
| Dale Steyn | 22 | 113 | 23.29 | 40.0 | 7/ 2 |
With Ntini usually opening the attack, it's hardly surprising that the batsmen he dismissed most often were openers. Chris Gayle, Matthew Hayden and Marcus Trescothick were all dismissed nine times each, with Daren Ganga and Andrew Strauss not far behind. The table below lists his averages against some of the batsmen he bowled to since November 2001 (some of the ball-by-ball data isn't available for Ntini before that period).
As the table shows, he did pretty well against the leading batsmen. Hayden and Gayle averaged less than 30 against him, while Sachin Tendulkar and Inzamam-ul-Haq didn't do too well against him either.
| Batsman | Runs | Balls | Dismissals | Average |
| Matthew Hayden | 241 | 448 | 9 | 26.77 |
| Marcus Trescothick | 303 | 546 | 9 | 33.66 |
| Daren Ganga | 94 | 275 | 8 | 11.75 |
| Chris Gayle | 206 | 299 | 8 | 25.75 |
| Andrew Strauss | 247 | 469 | 7 | 35.28 |
| Ricky Ponting | 336 | 421 | 6 | 56.00 |
| Michael Vaughan | 201 | 324 | 6 | 33.50 |
| Shivnarine Chanderpaul | 197 | 413 | 5 | 39.40 |
| VVS Laxman | 127 | 214 | 5 | 25.40 |
| Virender Sehwag | 202 | 277 | 5 | 40.40 |
| Inzamam-ul-Haq | 105 | 171 | 4 | 26.25 |
| Sachin Tendulkar | 94 | 154 | 4 | 23.50 |
| Rahul Dravid | 149 | 345 | 3 | 49.67 |
The three batsmen he dismissed most often were all left-handers, but overall, Ntini had far more success against the right-handers. His tendency to bowl from wide of the crease and angle the ball away perhaps made him more predictable against left-handers, while also eliminating the lbw almost completely: in his entire Test career, he only got 24 wickets lbw, and only five of those were of left-hand batsmen.
Against right-handers, on the other hand, his ability to straighten the ball after pitching helped him nail more wickets - his average against them was almost ten fewer than his average against the lefties.
| Batsman type | Runs | Balls | Dismissals | Average |
| Right-handers | 5674 | 10,327 | 229 | 24.77 |
| Left-handers | 4069 | 7721 | 119 | 34.19 |
S Rajesh is stats editor of Cricinfo