India firm favourites at home
India's batting might gives them a major advantage against West Indies, who have generally struggled to stay competitive in away series in the last decade
Madhusudhan Ramakrishnan
04-Nov-2011
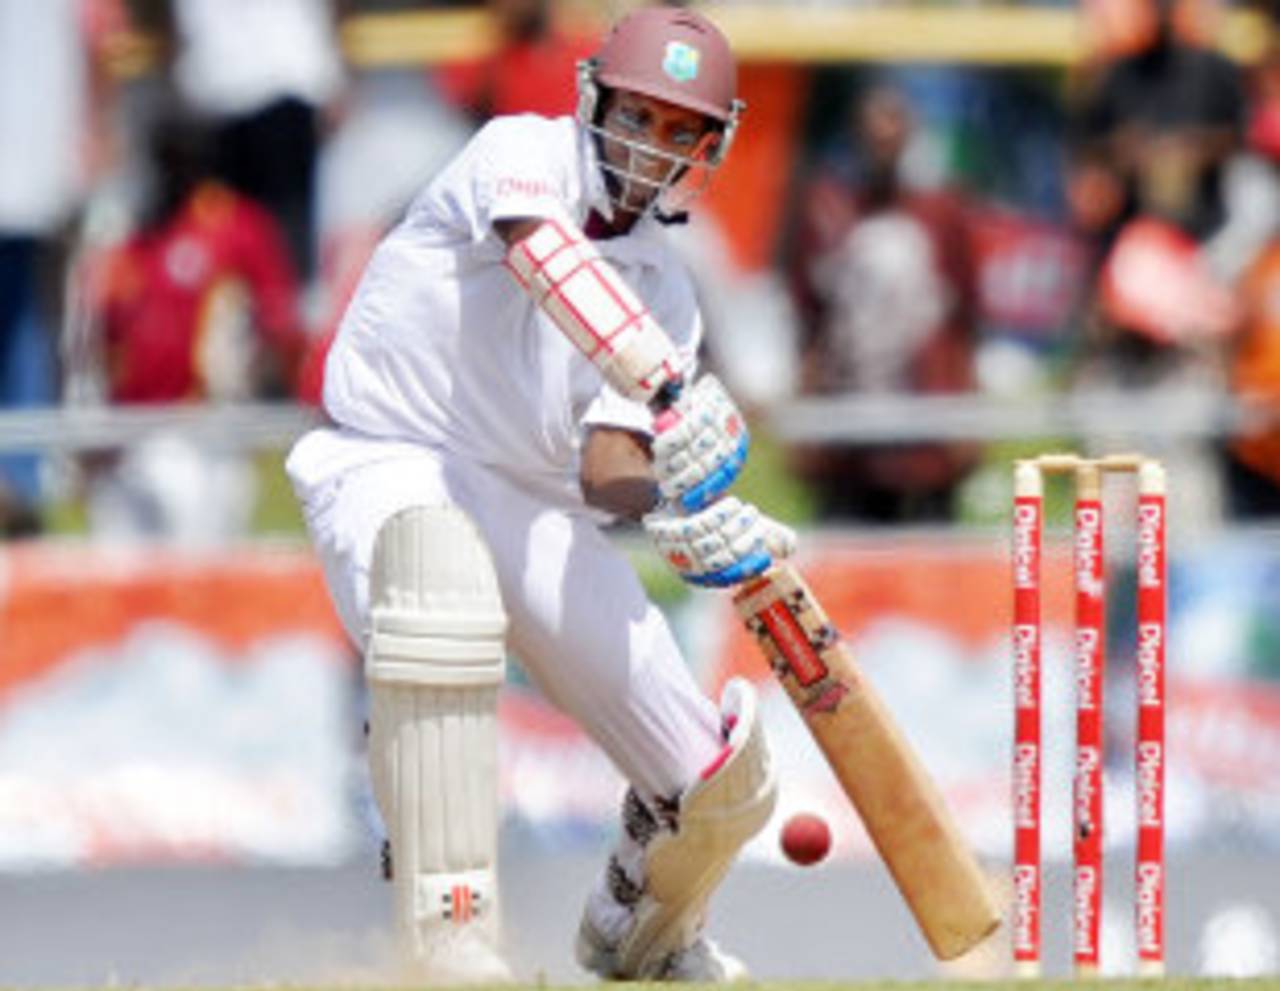
Shivnarine Chanderpaul is 178 runs away from becoming the second West Indies player to reach 2000 runs in Tests against India • AFP
No more the feared opponents
No other team's Test record has plummeted as rapidly as that of West Indies. From a position of virtual invincibility in the 1980s and the early 1990s when they did not lose a single series, they have gone nearly 15 years without a single away series win against a major Test team (excluding Bangladesh and Zimbabwe) while barely managing to maintain a decent home record. Most teams, including India and England, who for years struggled to win a single match against West Indies, have been able to register multiple series wins against them in the last ten years. A lack of batting discipline and dwindling fast bowling reserves, coupled with numerous administrative problems, have plagued West Indian cricket for more than a decade, resulting in a severe loss of form. Following the retirement of Brian Lara and the subsequent standoff between Chris Gayle and the board, the team has found it extremely hard to find a single match-winning batsman. Under Darren Sammy, West Indies showed glimpses of consistency in the home series against Pakistan and in the two-Test series in Bangladesh. They will, however, be hard-pressed to perform against India, who have lost just two home series since 2000.
No other team's Test record has plummeted as rapidly as that of West Indies. From a position of virtual invincibility in the 1980s and the early 1990s when they did not lose a single series, they have gone nearly 15 years without a single away series win against a major Test team (excluding Bangladesh and Zimbabwe) while barely managing to maintain a decent home record. Most teams, including India and England, who for years struggled to win a single match against West Indies, have been able to register multiple series wins against them in the last ten years. A lack of batting discipline and dwindling fast bowling reserves, coupled with numerous administrative problems, have plagued West Indian cricket for more than a decade, resulting in a severe loss of form. Following the retirement of Brian Lara and the subsequent standoff between Chris Gayle and the board, the team has found it extremely hard to find a single match-winning batsman. Under Darren Sammy, West Indies showed glimpses of consistency in the home series against Pakistan and in the two-Test series in Bangladesh. They will, however, be hard-pressed to perform against India, who have lost just two home series since 2000.
A recent spate of defeats brought West Indies' win-loss ratio below 1.00 for the first time since the end of the 1960s. Their overall win-loss ratio now stands at 0.94 (excluding matches against Zimbabwe and Bangladesh) and the average difference is only marginally above zero. In sharp contrast, the corresponding numbers in the 1980-1995 period are 3.15 and 7.36. After the home series defeat in 1995 to Australia, their fortunes dropped sharply. In the next five years, they lost by a 5-0 margin to both Australia and South Africa. Between 1996 and 2005, their win-loss ratio and average difference fell significantly to 0.32 and -8.24. Sadly, this decline was only the beginning. In the 45 matches played since 2006, they have managed just four wins while losing 21. Perhaps the best indicator of their struggles in the last few years is their abysmal away record. While they had a win-loss ratio of 2.42 in away Tests in matches played between 1980 and 1995, the number has dropped to just 0.05 in Tests since 2000.
| Played | Won | Lost | Drawn | W/L ratio | Batting avg | Bowling avg | Avg diff | |
| Overall | 461 | 146 | 154 | 160 | 0.94 | 32.42 | 32.41 | 0.01 |
| 1980-1995 | 129 | 63 | 20 | 46 | 3.15 | 34.11 | 26.75 | 7.36 |
| 1996-2005 | 96 | 18 | 56 | 22 | 0.32 | 27.87 | 36.11 | -8.24 |
| 2006-2011 | 45 | 4 | 21 | 20 | 0.19 | 29.91 | 41.59 | -11.68 |
| Away/neutral (since 2000) | 54 | 2 | 40 | 12 | 0.05 | 26.71 | 43.15 | -16.44 |
India dominant in recent clashes
It is ironical that West Indies, whose Test form is in the doldrums, have by far the best record in India among visiting teams. They have won 14 and lost just seven matches (win-loss ratio of 2.00) with only South Africa, with a win-loss ratio of 1.00 (five wins and five losses) coming close. They have, however, not toured India since 2002-03, when they lost 2-0. Till that defeat, the only series defeat suffered by West Indies in India was in 1978-79 when a weakened side lost 1-0. India, who boast an outstanding home Test record, will undoubtedly be a formidable opponent for a West Indian team that is still in the process of rebuilding.
It is ironical that West Indies, whose Test form is in the doldrums, have by far the best record in India among visiting teams. They have won 14 and lost just seven matches (win-loss ratio of 2.00) with only South Africa, with a win-loss ratio of 1.00 (five wins and five losses) coming close. They have, however, not toured India since 2002-03, when they lost 2-0. Till that defeat, the only series defeat suffered by West Indies in India was in 1978-79 when a weakened side lost 1-0. India, who boast an outstanding home Test record, will undoubtedly be a formidable opponent for a West Indian team that is still in the process of rebuilding.
Overall, West Indies have the better head-to-head record in both home and away Tests. They have a win-loss ratio of 2.50 in home matches and 2.00 in away games. The story, however, is vastly different in matches played since 1990. India hold a 3-1 advantage in home Tests played since 1990 and have also managed two series wins in the West Indies in the same period (2006 and 2011). The drop in average difference (difference between the batting and bowling average) for West Indies in recent home and away Tests against India also reflects their waning Test record.
| Played | West Indies (wins) | India (wins) | Draws | Batting avg (WI) | Bowling avg (WI) | |
| Overall | 85 | 30 | 12 | 43 | 37.35 | 31.94 |
| In India (overall) | 40 | 14 | 7 | 19 | 37.81 | 31.70 |
| In India (since 1990) | 6 | 1 | 3 | 2 | 31.13 | 37.69 |
| In West Indies (overall) | 45 | 16 | 5 | 24 | 36.93 | 32.18 |
| In West Indies (since 1990) | 17 | 3 | 3 | 11 | 32.51 | 33.60 |
Contrasting records for teams
Despite a 4-0 drubbing in the Test series in England, India have had an excellent run in the last three years. They registered two home series wins over Australia and drew home and away against South Africa. West Indies, on the other hand, have had very little to cheer about in the same period. Their solitary series success came when they defeated England 1-0 at home in early 2009. In 13 series played since the start of 2008, West Indies lost seven and drew four.
Despite a 4-0 drubbing in the Test series in England, India have had an excellent run in the last three years. They registered two home series wins over Australia and drew home and away against South Africa. West Indies, on the other hand, have had very little to cheer about in the same period. Their solitary series success came when they defeated England 1-0 at home in early 2009. In 13 series played since the start of 2008, West Indies lost seven and drew four.
India's powerful batting line-up has been the dominant factor behind their recent success in Tests. Their batting average of 39.03 is fourth among all teams during the same period. However, in the absence of Zaheer Khan, their bowling has been the weak link. On the tour of England, India struggled to bowl England out and lost on two occasions by an innings. Their bowling average of 38.60 is much higher than those of England, South Africa and Australia. On the other hand, West Indies' batting woes have meant that their batting average is lower than 30. They have the lowest average difference (-10.08) among all teams but a better hundreds-to-fifties ratio as compared to Pakistan and New Zealand. India's corresponding number (0.44) is fourth behind those of South Africa, England and Sri Lanka.
| Team | Played | W/L ratio | Bat avg | Bowl avg | Avg diff | 100s to 50s ratio |
| England | 48 | 2.77 | 41.51 | 31.43 | 10.08 | 0.54 |
| South Africa | 33 | 2.12 | 42.69 | 31.55 | 11.14 | 0.75 |
| India | 43 | 1.63 | 39.03 | 38.60 | 0.43 | 0.44 |
| Australia | 43 | 1.35 | 37.18 | 34.63 | 2.55 | 0.40 |
| Sri Lanka | 31 | 1.25 | 40.46 | 38.38 | 2.08 | 0.54 |
| Pakistan | 26 | 0.63 | 30.23 | 33.31 | -3.08 | 0.20 |
| New Zealand | 31 | 0.42 | 31.14 | 36.26 | -5.12 | 0.31 |
| West Indies | 34 | 0.26 | 29.95 | 40.04 | -10.09 | 0.3 |
India streets ahead on batting front
In recent years, West Indies have had very little to talk about when it comes to their batting stats. Only the experienced Shivnarine Chanderpaul, who recently became the highest-capped player for West Indies, has a record that matches those of India's top players. He has been fairly comfortable against pace and spin and has a high balls-per-dismissal value against both. Darren Bravo, who scored 195 in the second Test against Bangladesh, and Kirk Edwards are among the promising finds for West Indies. Edwards has scored two centuries in his first three Tests and is likely to retain his place in the middle order. Marlon Samuels, who scored a century in his last series in India, has made a return to the team after three years. Denesh Ramdin, however, has struggled against fast bowling, falling 26 times (74% of dismissals) and averaging 41 balls per dismissal.
In recent years, West Indies have had very little to talk about when it comes to their batting stats. Only the experienced Shivnarine Chanderpaul, who recently became the highest-capped player for West Indies, has a record that matches those of India's top players. He has been fairly comfortable against pace and spin and has a high balls-per-dismissal value against both. Darren Bravo, who scored 195 in the second Test against Bangladesh, and Kirk Edwards are among the promising finds for West Indies. Edwards has scored two centuries in his first three Tests and is likely to retain his place in the middle order. Marlon Samuels, who scored a century in his last series in India, has made a return to the team after three years. Denesh Ramdin, however, has struggled against fast bowling, falling 26 times (74% of dismissals) and averaging 41 balls per dismissal.
Although their technical lapses were exposed in the bowler-friendly conditions in England, India batsmen will be far more comfortable at home. The top-order batsmen have outstanding records in the last few years and this provides India with a distinct advantage going into the series. Sachin Tendulkar and Virender Sehwag, India's top two run-getters in matches played since the start of 2008, have similar dismissal stats against pace and spin but Sehwag does have a lower balls-per-dismissal value as a consequence of his highly aggressive approach. Rahul Dravid, who was India's stand-out batsman in the disastrous England series, has excellent numbers against pace and spin. Dravid, Tendulkar and VVS Laxman, who have all scored more than 1000 runs in Tests against West Indies, are part of the Indian middle order, thus making it an extremely challenging task for the inexperienced West Indian bowlers.
| Batsman | Runs | Avg | 100/50 | total | % dismissals, balls per dismissal (Pace) | % dismissals, balls per dismissal (Spin) |
| Sachin Tendulkar | 3599 | 61.00 | 14/13 | 59 | 64.40, 97.68 | 33.89, 141.10 |
| Virender Sehwag | 3580 | 55.93 | 10/15 | 64 | 64.06, 66.46 | 31.25, 60.20 |
| Rahul Dravid | 3071 | 46.53 | 11/11 | 66 | 68.18, 96.75 | 24.24, 165.81 |
| VVS Laxman | 2968 | 51.17 | 5/24 | 58 | 56.89, 90.30 | 37.93, 128.59 |
| Shivnarine Chanderpaul | 2199 | 59.43 | 6/13 | 37 | 54.05, 154.75 | 45.94, 139.00 |
| Denesh Ramdin | 777 | 22.85 | 1/3 | 34 | 76.47, 41.11 | 23.52, 58.12 |
| Darren Bravo | 751 | 46.93 | 1/6 | 16 | 50.00, 84.87 | 50.00, 121.37 |
| Marlon Samuels | 440 | 29.33 | 1/3 | 15 | 60.00, 71.22 | 40.00, 55.00 |
The absence of Zaheer and Harbhajan Singh means that India go into the first Test with a depleted attack. The fast-bowling department consists of Ishant Sharma, Umesh Yadav and Varun Aaron. On the spin front, R Ashwin will look to grab the opportunity presented to him and cement his place in the Test side. West Indies have a fairly strong pace attack following the return of Fidel Edwards from injury. He, along with Kemar Roach and Ravi Rampaul, will form the core of an attack which can be more than a handful. Devendra Bishoo, who has had a good start to his Test career with 32 wickets in his first seven Tests, will provide much-needed variety to the West Indian attack.
Mumbai, which will host one of the three matches, has not hosted a single Test since 2006. It has traditionally been a difficult pitch to bat on as can be seen from the batting averages across innings. However, it has been a result-oriented wicket with all five previous games producing results. Both pace bowlers and spinners have been highly successful in Mumbai although spinners have a better average. Both Delhi and Kolkata have been much better batting venues and have significantly better averages across the four innings. In both venues, spinners have picked up more wickets and average lower than fast bowlers.
| Venue | Matches | Result % | 1st inns (avg) | 2nd inns (avg) | 3rd inns (avg) | 4th inns (avg) | Pace (wickets, avg) | Spin (wickets, avg) |
| Delhi (2000-2008) | 5 | 80.00 | 40.97 | 43.06 | 29.29 | 34.65 | 59, 45.16 | 82, 33.42 |
| Mumbai (2000-2006) | 5 | 100.00 | 27.79 | 23.28 | 18.32 | 15.53 | 79, 23.17 | 87, 20.73 |
| Kolkata (2000-2010) | 6 | 66.67 | 44.12 | 45.91 | 46.47 | 29.69 | 77, 49.80 | 100, 35.89 |