Top-class top order v new-ball firepower
India's top-order batting has been the biggest success story of the tournament, but on Sunday they'll be up against an incisive fast-bowling attack
S Rajesh
22-Jun-2013
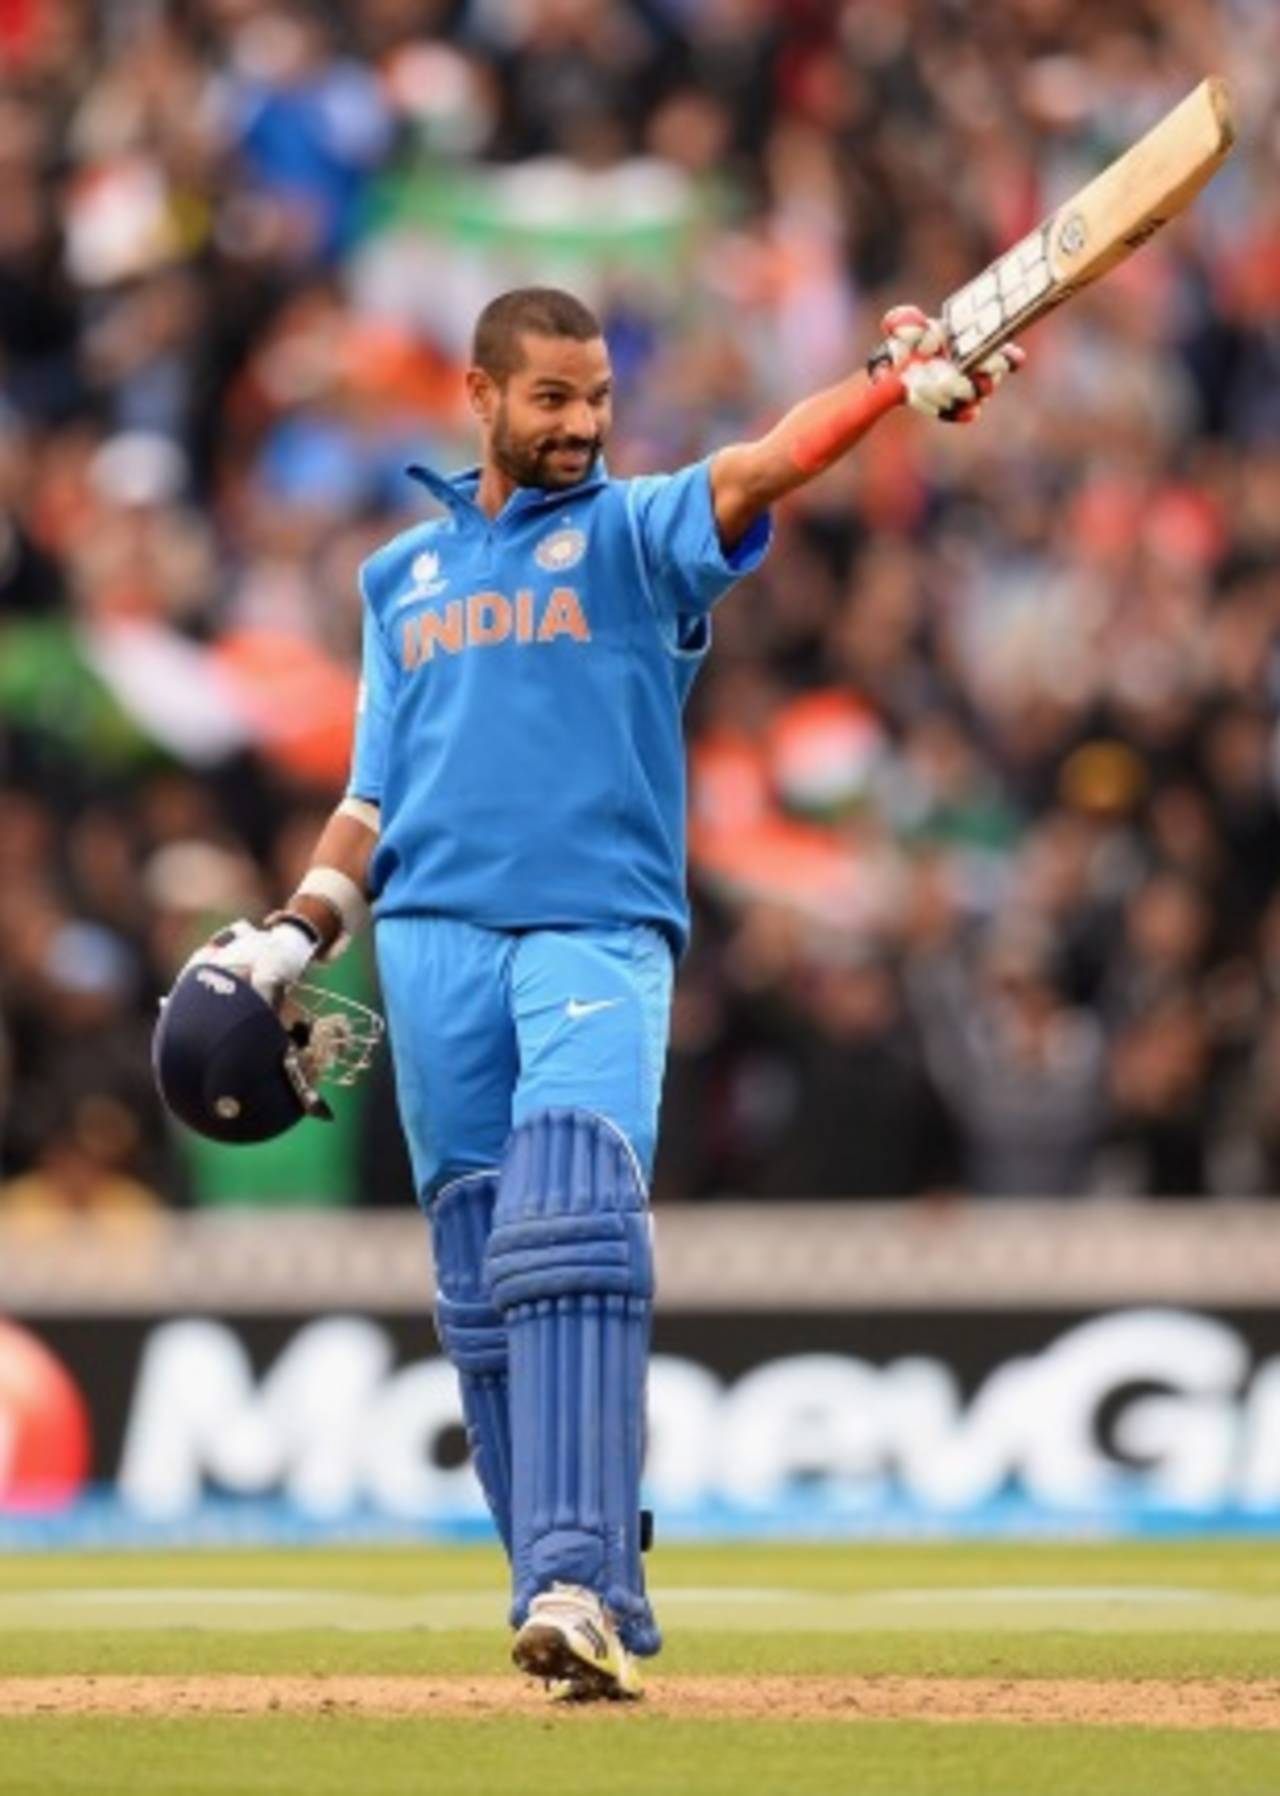
India's top-order batting, led by Shikhar Dhawan, has been the biggest success story of the tournament • Getty Images
Whichever way you look at it, India and England have been the two best teams in the 2013 Champions Trophy. India have won all four of their matches; England have won three and lost one - these two are the only sides in the tournament who've won more games than they've lost. India's average of 65.46 runs per wicket is by far the best of all teams in the tournament, while England's 35 is comfortably the second-best; ditto with the run rates of 5.93 (India) and 5.65 (England). As a bowling unit, India have taken the most wickets in the tournament - 37 - followed by England's 30. The difference between the run rate and the economy rate is 1.27 for India, the highest, and next-best for England (0.32). It's only fair that these two teams will compete for the right to be called the champions of the last edition of the Champions Trophy.
India's top-order batting has been the biggest success story of the tournament. Shikhar Dhawan has already amassed 332 runs in four innings - the third-highest by any batsman in any edition of the Champions Trophy - and has scored two out of three centuries in this tournament. India's batsmen have also accounted for three of the seven century stands in the tournament so far - two by the openers Dhawan and Rohit Sharma, and one by Dhawan and Dinesh Karthik.
England's top three haven't been as prolific, but they've also all been among the runs. Jonathan Trott has scored 209 runs - the third-highest in the tournament - at a strike rate of amost 90, which aren't bad stats for a batsman who supposedly can't score his runs quickly, while Alastair Cook and Ian Bell, the openers, have three fifties between them. England's middle order is in form too, with Joe Root looking impressive almost every time he has come out to bat in scoring 166 in four innings, while Ravi Bopara has been explosive at the finish, scoring 88 runs off only 61 balls in the tournament.
The flip side of the smashing form for India's top three is the fact that the rest of their batsmen have hardly had a bat. Karthik has faced 84 balls in the entire tournament, Ravindra Jadeja 29, MS Dhoni 26, and Suresh Raina 10. India's top three have accounted for 78% of the bat runs for India; the corresponding percentage for England is 59. It's fair to say that India's middle order hasn't been tested yet, and Sunday could well be an occasion for them to prove their worth.
| Team | Won/ lost | Bat ave | Run rate | Bowl ave | Econ rate | 100s/ 50s | 100/ 50 p'ships |
| India | 4/ 0 | 65.46 | 5.93 | 23.89 | 4.66 | 2/ 5 | 3/ 4 |
| England | 3/ 1 | 35.00 | 5.65 | 28.40 | 5.33 | 0/ 6 | 2/ 5 |
| Batsman | Innings | Runs | Average | Strike rate | 100s/ 50s |
| Shikhar Dhawan | 4 | 332 | 110.67 | 99.40 | 2/ 1 |
| Jonathan Trott | 4 | 209 | 69.67 | 89.69 | 0/ 2 |
| Rohit Sharma | 4 | 168 | 42.00 | 76.71 | 0/ 2 |
| Joe Root | 4 | 166 | 41.50 | 90.71 | 0/ 1 |
| Alastair Cook | 4 | 159 | 39.75 | 81.53 | 0/ 2 |
| Ian Bell | 4 | 141 | 35.25 | 74.21 | 0/ 1 |
| Virat Kohli | 4 | 133 | 66.50 | 88.66 | 0/ 1 |
| Ravi Bopara | 3 | 88 | 88.00 | 144.26 | 0/ 0 |
| Team | Innings | Runs | Average | Strike rate | 100s/ 50s | % of team runs* |
| India | 12 | 633 | 70.33 | 90.04 | 2/ 4 | 78.24 |
| England | 12 | 509 | 46.27 | 82.36 | 0/ 5 | 58.98 |
The bowling comparison
As a bowling unit, there isn't much to choose between the two sides. England's bowlers had one poor game, when they completely dominated by Kumar Sangakkara, while India conceded more than 300 against South Africa (though they won that one). India's bowlers have taken more wickets at a better average and economy rate, thanks largely to their spinners. Led by Jadeja, India's spin attack has taken 16 wickets at an average of 20.75 and an economy rate of 4.15, figures which even the most optimistic Indian fan wouldn't have bargained for in June in England.
As a bowling unit, there isn't much to choose between the two sides. England's bowlers had one poor game, when they completely dominated by Kumar Sangakkara, while India conceded more than 300 against South Africa (though they won that one). India's bowlers have taken more wickets at a better average and economy rate, thanks largely to their spinners. Led by Jadeja, India's spin attack has taken 16 wickets at an average of 20.75 and an economy rate of 4.15, figures which even the most optimistic Indian fan wouldn't have bargained for in June in England.
England's star in the bowling department has been James Anderson. He has taken twice as many wickets as the next-best for England, while his economy rate has been outstanding as well. India's most consistent seamer has been Bhuvneshwar Kumar: his 32 overs have gone at only 3.68 per over, though Ishant Sharma is the leading wicket-taker with eight. The disappointment for India has been Umesh Yadav, who has leaked plenty of runs after taking a five-for against Australia in one of the warm-up games. Similarly, Tim Bresnan has been the most expensive among the regular bowlers for England, going at almost a run a ball.
| Pace | Spin | Overall | |||||||
| Team | Wkts | Ave | Econ | Wkts | Ave | Econ | Wkts | Ave | Econ |
| India | 17 | 31.88 | 4.94 | 16 | 20.75 | 4.15 | 33 | 26.48 | 4.60 |
| England | 23 | 26.52 | 5.17 | 6 | 36.00 | 5.14 | 29 | 28.48 | 5.16 |
| Bowler | Overs | Wickets | Average | Econ rate |
| James Anderson | 33 | 10 | 12.70 | 3.84 |
| Ravindra Jadeja | 37 | 10 | 13.00 | 3.51 |
| Ishant Sharma | 34 | 8 | 22.75 | 5.35 |
| R Ashwin | 37 | 6 | 27.67 | 4.48 |
| Bhuvneshwar Kumar | 32 | 6 | 19.67 | 3.68 |
| Stuart Broad | 31.5 | 5 | 35.40 | 5.56 |
The Powerplay factor
India's openers have been so strong that the team hasn't yet lost a wicket in the mandatory Powerplays, making scores of 66, 53, 45 and 40 - all without loss - at the ten-over mark in their four matches so far. England's top order has done pretty well too, but it's their bowling at the start which has stood out: they've taken six wickets in the mandatory Powerplay overs, and have conceded only 4.14 runs per over. On Sunday, they'll be up against the best top order of the tournament, and how that mini-battle turns out could well determine the outcome of the final.
India's openers have been so strong that the team hasn't yet lost a wicket in the mandatory Powerplays, making scores of 66, 53, 45 and 40 - all without loss - at the ten-over mark in their four matches so far. England's top order has done pretty well too, but it's their bowling at the start which has stood out: they've taken six wickets in the mandatory Powerplay overs, and have conceded only 4.14 runs per over. On Sunday, they'll be up against the best top order of the tournament, and how that mini-battle turns out could well determine the outcome of the final.
In the batting Powerplay, India have the better numbers with both bat and ball. Most teams have lost plenty of wickets during this period, which has impacted their ability to score quickly, but India aren't one of those sides: they've lost only two wickets, and their run rate is the second-best (after New Zealand) among all teams during this period. England, on the other hand, have lost five wickets in 87 balls during the batting Powerplay.
| Batting | Bowling | |||||
| Team | Runs/ Balls | Average | Run rate | Runs/ balls | Average | Econ rate |
| India | 204/ 228 | - | 5.36 | 201/ 240 | 40.20 | 5.02 |
| England | 164/ 210 | 54.67 | 4.68 | 145/ 210 | 24.16 | 4.14 |
| Batting | Bowling | |||||
| Team | Runs/ Balls | Average | Run rate | Runs/ Balls | Average | Econ rate |
| India | 69/ 55 | 34.50 | 7.52 | 90/ 102 | 22.50 | 5.29 |
| England | 98/ 87 | 19.60 | 6.75 | 112/ 102 | 28.00 | 6.58 |
England's strong home record
England's one advantage, though, is their head-to-head record against India at home in the last nine years. In their last 15 such games - going back to 2004 - they have a 9-4 win-loss record, including three wins in the 2011 bilateral series.
England's one advantage, though, is their head-to-head record against India at home in the last nine years. In their last 15 such games - going back to 2004 - they have a 9-4 win-loss record, including three wins in the 2011 bilateral series.
India have had a few setbacks against England in their recent encounters, but in the only tournament final played between these two teams in ODIs, India came out on top in a memorable match, when they chased down 326 at Lord's in 2002. Come Sunday, and England will want to set that record straight.
| Matches | Ind won | Eng won | Tie/ NR | |
| Overall | 86 | 46 | 35 | 2/ 3 |
| In England | 33 | 11 | 18 | 1/ 3 |
| Since 2004 in England | 15 | 4 | 9 | 1/ 1 |
| Tournament final | 1 | 1 | 0 | 0 |
S Rajesh is stats editor of ESPNcricinfo. Follow him on Twitter