Failing openers, and flourishing quicks
Stats highlights from the UAE leg of IPL 2014
Bishen Jeswant
01-May-2014
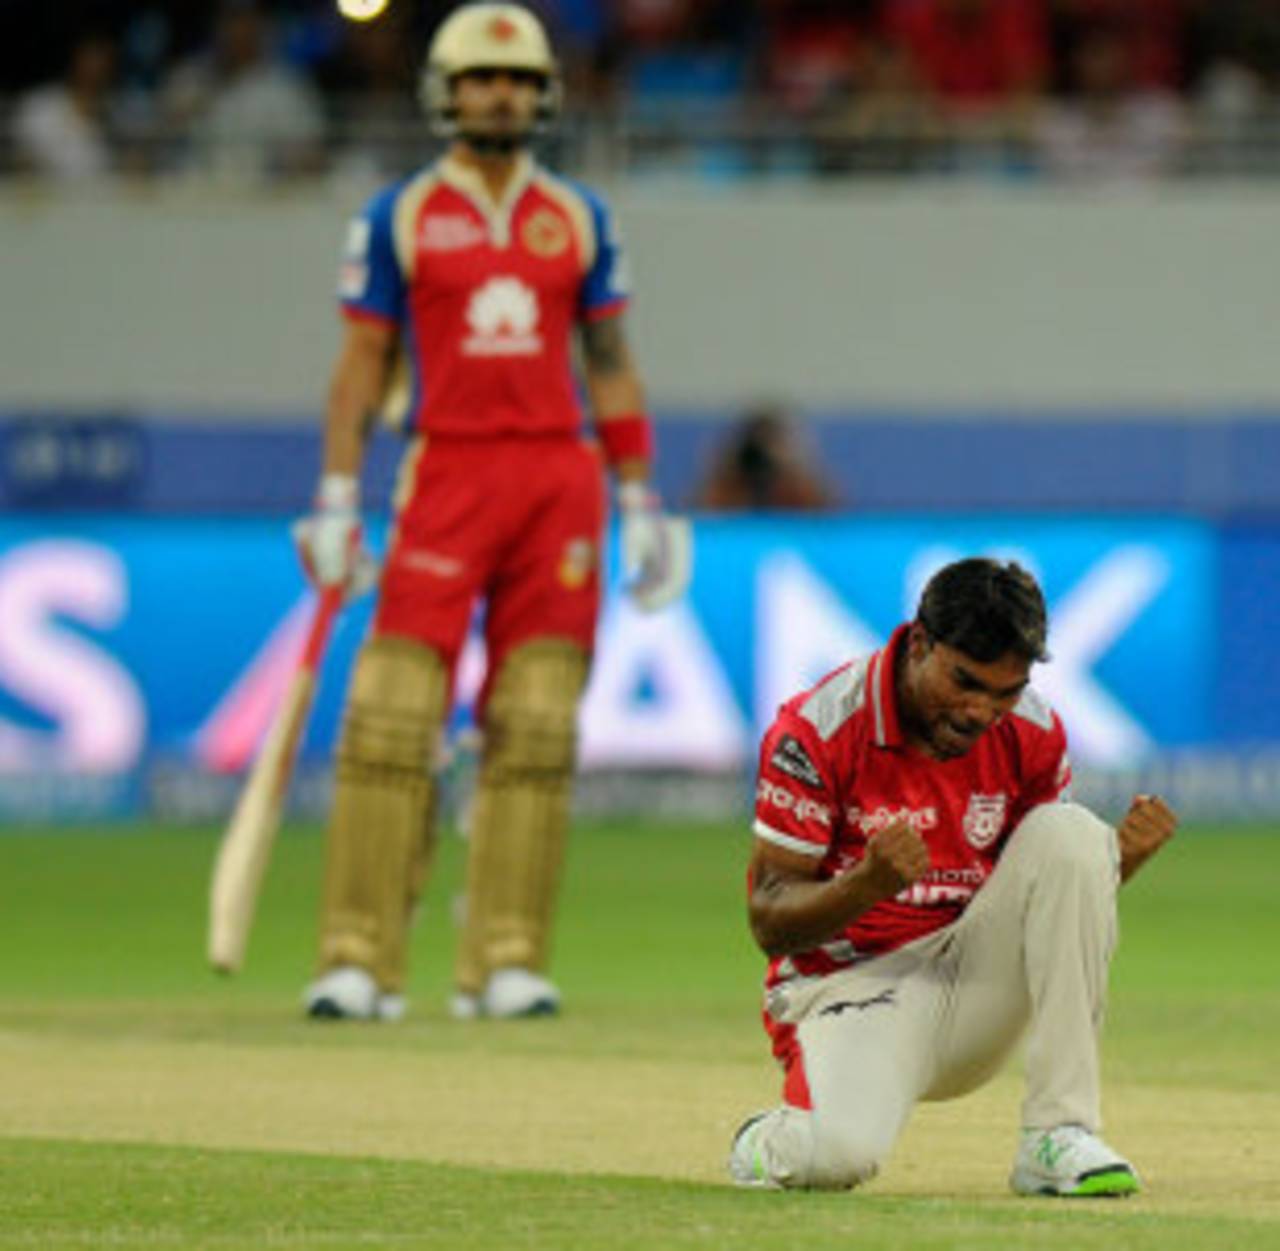
Indian bowlers like Sandeep Sharma have starred while star Indian batsmen like Virat Kohli have remained in the background • BCCI
The UAE leg of the IPL is done, with each team having played five matches. Fortunes of the teams have varied, with one team having won all five games and another hurtling towards the wooden spoon after having lost all five. Here is a look at some of the stand-out numbers from the 20 matches in the UAE.
International Indian tournament
The IPL, essentially a domestic tournament, has now been held outside India twice in its seven-year history. Both foreign venues, South Africa and the United Arab Emirates, have contrasting playing conditions, with the pitches and weather in both countries throwing up wholly different sets of challenges. The batsmen had the toughest time in South Africa, scoring only 23.41 runs per wicket - the worst for any IPL season. Despite conditions in UAE being not so dissimilar to India, the season so far has seen the worst runs-per-wicket stat for any IPL season (24.67) since the South African edition. These two editions of the IPL have also seen the lowest run-rates as well as the highest balls-per-boundary ratio in the tournament's history.
Last year, for instance, teams averaged 24.79 per wicket and 7.67 per over, while scoring a boundary every 6.48 balls. All of those numbers have been more in favour of the bowling team this time.
One would expect more boundaries to be hit in UAE as compared to South Africa, but the balls-per-boundary in UAE and South Africa have been about the same. Clearly, the batsmen have a better time when the tournament is played on Indian shores.
| Season | Matches | Runs per Wicket | Runs per Over | Balls per Boundary |
| 2008 | 58 | 26.03 | 8.30 | 5.60 |
| 2009 | 57 | 23.41 | 7.48 | 7.22 |
| 2010 | 60 | 26.20 | 8.12 | 6.09 |
| 2011 | 73 | 26.01 | 7.72 | 6.46 |
| 2012 | 75 | 26.19 | 7.82 | 6.53 |
| 2013 | 76 | 24.79 | 7.67 | 6.48 |
| 2014 | 20 | 24.67 | 7.55 | 7.23 |
Bowling not so thankless
In 20-over cricket, batsmen often walk away with all the awards and honours despite the bowlers putting in a lot of hard work. However, this time around, the bowlers have done enough to bag the Man-of-the-Match award in eight out of 20 matches. At a similar stage in last year's tournament, only four bowling performances had won the MoM award. Even in the 2012 edition, only six bowling performances were considered worthy of MoM awards after 20 matches (excluding a couple of all-round shows by Ravindra Jadeja and Keiron Pollard).
India shining
The Indian fast bowlers have shone brightly in this edition of the IPL. Even bowlers like Varun Aaron, who have historically been expensive, have shown far greater control and consistency. Four of the top five fast bowlers, in terms of wickets taken, are Indians - Lasith Malinga is the only non-Indian. The table below (of Indian bowlers who have bowled at least five overs and taken at least two wickets) will show that many of the Indian bowlers have gone for less than seven runs per over. Even bowlers like L Balaji and Jaidev Unadkat, who have conceded more than seven, have compensated by taking wickets. Vinay Kumar hasn't taken too many wickets, but he bowled that high-pressure last over against the Royal Challenger Bangalore. Sandeep Sharma deserves a special mention because he has taken wickets and been economical while dismissing big players at crucial junctures and has deservedly won two MoM awards.
| Bowler | Overs | Wickets | BBI | Average | Economy | Strike Rate |
| Sandeep Sharma | 11.0 | 7 | 3/15 | 8.85 | 5.63 | 9.4 |
| VR Aaron | 14.5 | 8 | 3/16 | 10.50 | 5.66 | 11.1 |
| STR Binny | 5.0 | 2 | 1/1 | 14.50 | 5.80 | 15.0 |
| IC Pandey | 15.0 | 3 | 2/23 | 29.33 | 5.86 | 30.0 |
| B Kumar | 19.3 | 8 | 3/19 | 15.00 | 6.15 | 14.6 |
| R Dhawan | 13.2 | 4 | 2/14 | 20.50 | 6.15 | 20.0 |
| Z Khan | 18.5 | 5 | 2/21 | 23.60 | 6.26 | 22.6 |
| MM Sharma | 15.5 | 8 | 4/14 | 13.25 | 6.69 | 11.8 |
| R Bhatia | 16.0 | 6 | 2/13 | 18.16 | 6.81 | 16.0 |
| AB Dinda | 17.0 | 2 | 1/14 | 59.00 | 6.94 | 51.0 |
| L Balaji | 19.0 | 8 | 4/13 | 17.50 | 7.36 | 14.2 |
| R Vinay Kumar | 14.0 | 4 | 2/26 | 26.50 | 7.57 | 21.0 |
| JD Unadkat | 16.0 | 6 | 3/32 | 21.50 | 8.06 | 16.0 |
| I Sharma | 8.0 | 3 | 2/37 | 22.00 | 8.25 | 16.0 |
| DS Kulkarni | 11.0 | 3 | 2/23 | 30.33 | 8.27 | 22.0 |
| M Shami | 20.0 | 3 | 1/30 | 60.00 | 9.00 | 40.0 |
| P Awana | 7.0 | 2 | 1/35 | 37.50 | 10.71 | 21.0 |
Conspicuously low on this table are India regulars Mohammed Shami and Ishant Sharma. Both of them have taken only three wickets each while conceding more than eight runs per over.
Stars not shining
In the same the way that Shami and Ishant haven't had great returns, some of India's superstar batsmen have also failed to turn up. While Gambhir's dismal form, including the three back-to-back ducks, has been well documented, many of the other Indian stalwarts have also had poor outings. Among the big names in the below table, only Virender Sehwag has a strike-rate of more than 120. Also, all of these batsmen, except Yuvraj Singh and M Vijay, have aggregated less than 120 runs in the tournament. The fact that Yuvraj Singh, despite his indifferent form, looks the best on paper (Runs: 121, Avg: 30.25, SR: 116.34) is testimony to the fact that the big-money Indians have performed poorly.
| Batsman | Innings | Runs | High Score | Average | Strike Rate |
| G Gambhir | 5 | 46 | 45 | 9.20 | 74.19 |
| RG Sharma | 5 | 84 | 50 | 16.80 | 110.52 |
| S Dhawan | 5 | 85 | 38 | 17.00 | 114.86 |
| SK Raina | 5 | 99 | 56 | 19.80 | 119.27 |
| V Kohli | 5 | 105 | 49* | 26.25 | 116.66 |
| V Sehwag | 5 | 120 | 37 | 24.00 | 126.31 |
| M Vijay | 5 | 121 | 52 | 24.20 | 112.03 |
| Yuvraj Siingh | 5 | 121 | 52* | 30.25 | 116.34 |
The only Indian specialist batsmen to make some sort of mark on this tournament are Ajinkya Rahane (Runs: 182, Avg: 36.40, SR: 120.52) and Manish Pandey (Runs: 144, Avg: 28.80, SR: 121.00). Only one Indian, Rahane, finds a place among the top eight run-scorers in the tournament. The foreign batsmen have made an impact with Dwayne Smith, David Warner, Brendon McCullum, JP Duminy, Glenn Maxwell and David Miller all scoring two or more fifties. Apart from these six, Aaron Finch has also been quite consistent and finds a place among the top eight run-getters in this tournament. The only marquee Indian batsman to have done well is MS Dhoni who has an average of 30.00 after five innings at a strike rate of 152.54.
Openers yet to open up
Openers have typically scored heavily in the IPL, with seven of the top 15 run scorers (across all IPL seasons) being openers. However, apart from Smith, McCullum and, to a lesser extent, Finch, the openers have not found themselves among the runs so far in this tournament. Openers are expected to make optimal use of the Powerplay overs, but their strike rate in this edition of the tournament is an abysmal 117.13 - the lowest for any season. Also, they only averaged 24.28 in this UAE leg, which is lower than all seasons except 2009, when the tournament was held in South Africa. Openers have scored at least one hundred in every season of the IPL so far. While no opener has scored a hundred so far, the flat Indian wickets should ensure that this record remains intact.
| Season | Innings | Average | Strike Rate | Hundreds | Sixes |
| 2008 | 232 | 29.46 | 130.42 | 4 | 196 |
| 2009 | 228 | 23.65 | 117.88 | 1 | 175 |
| 2010 | 240 | 29.56 | 130.21 | 3 | 196 |
| 2011 | 290 | 28.52 | 124.91 | 6 | 241 |
| 2012 | 296 | 29.62 | 125.95 | 4 | 264 |
| 2013 | 304 | 27.25 | 120.18 | 2 | 217 |
| 2014 | 80 | 24.28 | 117.13 | 0 | 49 |
Keeping with this trend, the number of sixes per innings has been the worst for any edition of the IPL - 0.61 sixes per innings. If not for the belligerence of Dwayne Smith, Brendon McCullum and Aaron Finch, who hit 29 of the 49 sixes, this stat could have made the openers look worse still.
No Powerplay spin
In the last few seasons of the IPL, spinners have played key roles in the Powerplays, but the same cannot be said of the UAE leg of this year's IPL. Spinners have bowled in the Powerplay in 27 innings but have taken only four wickets. Their average of 69.25 in the Powerplay is the worst for any season of the IPL. Their economy rate of 7.10 the worst since the inaugural season where spinners hardly bowled in the Powerplay (they bowled 30 overs in the whole season, whereas almost 40 overs have already been bowled in the 20 matches played this season) and went for 8.86 runs per over.
| Season | Inninngs | Run Rate | Wickets | Average |
| 2008 | 24 | 8.86 | 8 | 33.25 |
| 2009 | 48 | 6.88 | 19 | 26.73 |
| 2010 | 77 | 6.98 | 33 | 28.36 |
| 2011 | 100 | 6.81 | 53 | 25.69 |
| 2012 | 109 | 6.90 | 35 | 41.65 |
| 2013 | 79 | 6.53 | 29 | 33.89 |
| 2014 | 27 | 7.10 | 4 | 69.25 |
Bishen Jeswant is a stats sub-editor at ESPNcricinfo. He tweets here.