The debate about Pujara's strike-rate
Cheteshwar Pujara's strike rate has been a worry over the last 30 months, but much of it is to do with his inability to score against pace when playing overseas
S Rajesh
27-Sep-2016
ESPNcricinfo Ltd
One of the significant pluses for India in the Kanpur Test was the performance of Cheteshwar Pujara at No. 3. In both innings of the match, he made significant contributions, and more importantly, got his runs at an excellent tempo, scoring 140 off 261 balls, a strike rate of 53.6. Before the game, Pujara's inability to increase his scoring rate after settling in had been an area of concern for the team management, and Virat Kohli admitted that he and Anil Kumble, the coach, had spoken to him about it. That aspect had been particularly glaring in the West Indies, where Pujara scored 62 runs off 226 balls (strike rate 27.4) and was dropped for the third Test.
Has there been a problem with Pujara's strike-rate?
9 votesYes - he hasn't scored quickly when the match situation demands
No - it's much ado about nothing at No. 3 in the line-up
Since his comeback in August 2012, Pujara's strike rate, coming into this New Zealand series, was 48.05. Among batsmen with 2000-plus runs during this period, only four have a lower strike rate, but his rate wasn't that much slower than some of the other top batsmen during this period: Hashim Amla's was 47.73, Kane Williamson's 50.47, and AB de Villiers' 51.24. Where Pujara had slipped up was in the last two-and-a-half years: since the start of 2014, his scoring had dropped to 42.39, about 20% lesser than his strike rate in the 2012-13 period. It was the lowest among Indian batsmen during this period, and third-lowest out of 47 batsmen who had scored 750-plus Test runs in this phase. Only Faf du Plessis (strike rate 38) and Kaushal Silva (40.88) had more sluggish scoring rates than Pujara.
| Period | Tests | Runs | Average | Strike rate | 100s/ 50s |
| Aug 2012 to Dec 2013 | 14 | 1483 | 78.05 | 52.25 | 6/ 3 |
| Jan 2014 to Aug 2016 | 18 | 892 | 30.75 | 42.39 | 1/ 3 |
| Player | Tests | Runs | Average | Strike rate |
| Faf du Plessis | 20 | 1041 | 34.70 | 38.00 |
| Kaushal Silva | 26 | 1545 | 32.18 | 40.88 |
| Cheteshwar Pujara | 18 | 892 | 30.75 | 42.39 |
| Hashim Amla | 21 | 1514 | 50.46 | 43.43 |
| Azhar Ali | 18 | 1641 | 51.28 | 44.01 |
| BJ Watling | 23 | 1366 | 42.68 | 44.42 |
| Dean Elgar | 19 | 1053 | 37.60 | 44.65 |
| Marlon Samuels | 17 | 791 | 26.36 | 44.66 |
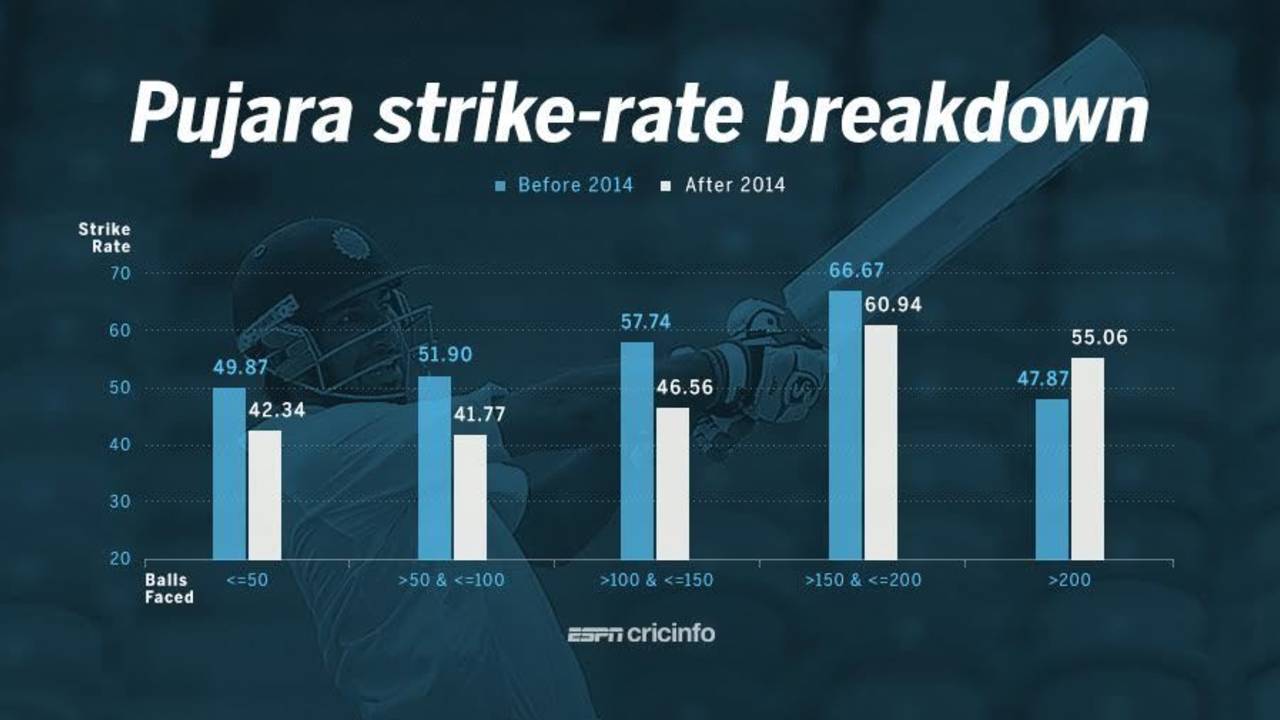
The aspect that had particularly worried Kohli and Kumble was Pujara's tendency to get stuck after getting starts. As the table below shows, his strike rate since 2014 remained in the 40s even after the first 50 balls of his innings, whereas earlier he had shown the ability to shift gears and up his scoring rate into the 50s after settling in.
| Balls Faced | SR Before 2014 | SR Since 2014 |
| <=50 | 49.87 | 42.34 |
| 51 to 100 | 51.90 | 41.77 |
| 101 to 150 | 57.74 | 46.56 |
| 151 to 200 | 66.67 | 60.94 |
| >200 balls | 47.87 | 55.06 |
Given these numbers in the 30 months prior to this series, Pujara's comeback in Kanpur was encouraging, but not entirely surprising given how he has performed at home in the past. Since August 2012, Pujara has averaged 67.17 (strike rate 52.87) at home, and 35.92 (strike rate 42.52) in away Tests. The averages and strike rates resemble those before and since 2014, and that is because India's schedules have been similarly lopsided: 14 out of his 18 Tests in the last 30 months have been away games. The only home series during this period was against South Africa: Pujara managed a strike rate of 48 in that series despite the pitches being particularly difficult for batting.
Through the last 30 months, Pujara's major problem has been his tendency to get bogged down against pace, an aspect that was not tested much in Kanpur. Even during the period when Pujara was struggling to score quickly, he still made his runs at a fair clip against spin: since the beginning of 2014 and before the Kanpur Test, his strike rate against spin was 52.29, but against pace it dropped to 38.14. In the Kanpur Test, he faced only 36 balls against pace and scored 12 (strike rate 33.33), while against spin he continued to get his runs comfortably, scoring 128 from 225 balls (strike rate 56.89). In the 2012-13 period, he was far more assertive against pace as well, though 12 of his 14 Tests during this period were in India.
| Bowler type | Runs | Balls | Dismissals | Strike rate |
| Pace | 561 | 1471 | 19 | 38.13 |
| Spin | 331 | 633 | 10 | 52.29 |
| Bowler type | Runs | Balls | Dismissals | Strike rate |
| Pace | 777 | 1434 | 8 | 54.18 |
| Spin | 706 | 1404 | 9 | 50.28 |
Admittedly, on the West Indies tour, Pujara completely went into his shell, against both pace and spin: he scored at a strike rate of 38 against spin, and 20 against pace. After those pedestrian numbers, it isn't surprising that the team management discussed the issue with him. The Kanpur numbers are encouraging, but the real test for Pujara continues to be his numbers outside Asia. With India scheduled to play 12 more home Tests this season, that issue won't come up any time soon, though.
S Rajesh is stats editor of ESPNcricinfo. @rajeshstats