What is the greatest performance in a single Test?
A detailed analysis combining a scorecard-based match contribution factor, and a context-driven performance rating
Anantha Narayanan
13-Dec-2025 • 20 hrs ago
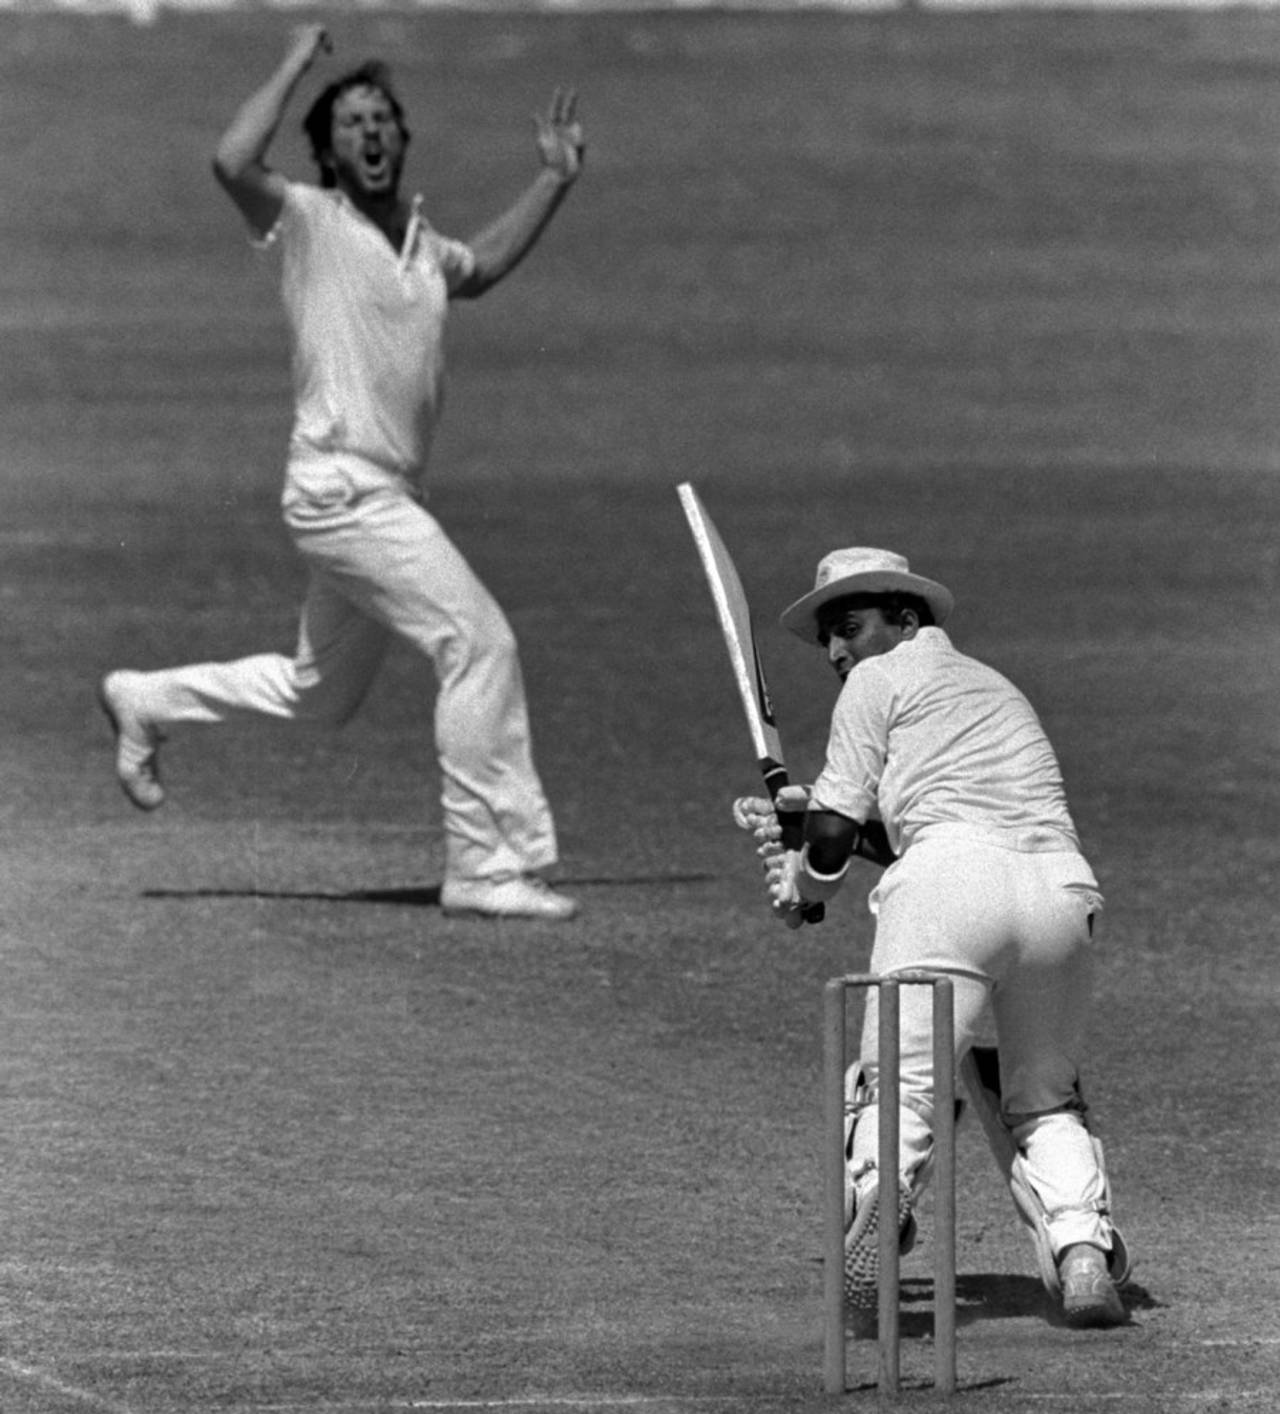
Ian Botham's dismantling of India at the Wankhede in 1980 - 114 runs, 6 for 58 and 7 for 48 - ranks as the greatest all-round Test performance by the Match-Performance-Index metric • Getty Images
This is a new measure and one of the most important of my creations - a single measure that quantifies the overall match performances of 22 players. A comprehensive compilation of batting, bowling and fielding performances - numbers and context-based. I would include this in my list of three most significant measures. This measure is a composite of two key processes - the Contribution Analysis and the Performance Rating Analysis. The article is current up to and including the Christchurch thriller - that fight for the ages by West Indies.
1. Team Performance Points (TPP)/Player Contributions
These points are based on a complex numbers-based analyses of the scores. It is an exercise jointly undertaken by me and Milind Pandit more than a decade back. Suffice to mention that a very complex five-stage allocation process provides points for a match, teams, innings, functions and players. We move from the match level in a top-down approach. The overall guidelines and the cornerstones of allocation are given below.
An important feature of the contribution process is that the initial values are determined at the match level, then worked downwards to lower levels, to the players, and then worked upwards again to the match level. This is important since the contribution of a player makes sense only when compiled at the match level. The player has to be allowed all four innings to provide his contributions. He should be able to make up for one average performance in other innings of the match.
Another key feature is that the analysis is done using only the scorecard. No external reference is made to the team or player data. The important fact is that if the exact scores were repeated with two other teams and 22 other players, the contribution values would be identical. Absolutely no reference is made to the team strengths, recent results, players' career-to-date values, recent form etc.
The capping of 100 points for the match, and the top-down allocation of points, five levels down, to the players, will ensure that all the performances are properly valued. There is a ceiling and it is not an open-ended valuation.
A schematic of the complete allocation process is given below.
- All results (excluding the Centurion Test in 2000 and The Oval Test in 2006, for obvious reasons - covered later in the piece) will get allocated 100 points. Let me call this total allocation MTP (Match Team Performance points).
- The two teams playing a tied match will be allocated 50.0 TPP each. These are considered as results.
- All innings wins are allotted 75-plus points. All run wins and wins by wickets are allotted 50-plus points. However, depending on the margins and match scoring patterns, wins by runs could get more than 75 points. For instance, Australia received 75.1 points for their win by an innings and 5 runs against Pakistan in Brisbane in 2019, while they secured 76.0 points for their 296-run win over New Zealand in Perth a month later.
-The actual points allocation depend on the scoring patterns in the Test. Two five-wicket wins may get differing allocation of points. A win by an innings and 50 runs could get more points than a win by an innings and 200 runs.
- Drawn matches will get MTP allocations below 100, depending on the extent of completion of the match. The points allocated range from 99.8 to 0.4. The team that is ahead in the match will get more points. Please see the Johannesburg Test between South Africa and Australia in 1967: South Africa got close to the number of points a team would get for an innings win. A two-innings draw will get 50 points if either of the teams has taken the first-innings lead.
- The MTP allocations of 50-plus points is an important landmark in the overall scenario. This represents the completion of two innings in that a team has taken the first-innings lead or the scores are tied. It must be understood that the lead has to be secured to get that 50-plus value. A few examples will suffice.
- A scoreline of 900, 800 for 3 will get MTP below 50.0
- A scoreline of 200, 199 for 1 will get MTP below 50.0
- A scoreline of 50, 60 for 8 will get MTP above 50.0
- A scoreline of 500 for 3, 550 for 7 will get MTP above 50.0
- A scoreline of 300, 300 for 3 will get MTP equal to 50.0
- The points allocated to the teams are further allocated to each innings, batting/bowling, and then on to the players themselves. So, it is clear that the players from the teams that do well in the Test will get more points. This is understandable since this is a non-contextual "contribution" exercise.
- To the extent possible, equalisation is done between the batting and bowling disciplines. This is not always achievable since there would be only one batting innings if the team wins by an innings, while there would be two bowling innings, barring a few Tests.
- Assuming matching innings allocations, within the innings, a player contribution of 5 for 20 or 50 in 50 balls will always get more points than a contribution of 5 for 50 or 50 in 100 balls.
A few TPP allocations are provided below.
- 50.1:49.9 for a one-run win (Adelaide, 1993 - West Indies 252 and 146, Australia 213 and 184).
- 50.4:49.6 for a one-wicket win (Durban, 2019 - South Africa 235 and 259, Sri Lanka 191 and 304 for 9).
- 71.2:28.8 for a nine-wicket win (Christchurch, 2017 - Bangladesh 289 and 173, New Zealand 354 and 111 for 1).
- 90.6:9.4 for a win by an innings and 198 runs (Sharjah, 2002 - Pakistan 59 and 53, Australia 310).
- 94.2:5.8 for a 675-run win (Brisbane, 1928 - England 521 and 342 for 8, Aus 122 and 66).
- 50.6:49.2 for India for the draw with scores level and nine wickets down (Mumbai, 2011 - West Indies 590 and 134, India 482 and 242 for 9).
- 49.0:46.5 for Australia for the recent fighting draw by India down under (Sydney, 2021 - Australia 338 and 312 for 6, India 244 and 334 for 5).
- 74.5:23.1 for South Africa for the near-win draw at Wanderers (Johannesburg, 1967 - Australia 143 and 148 for 8, South Africa 332).
- 43.4:30.9 for a three-innings draw (Wellington, 2018 - Sri Lanka 282 and 287 for 3, New Zealand 578).
- 0.3:0.1 for a 10-ball draw (North Sound, 2009 - Eng 7 for 0).
Onwards to two specially treated Tests.
- 26.2:23.8 in favour of England for winning their single-innings Test over South Africa (Centurion, 2000 - South Africa 248 for 8 and 0, England 0 and 251 for 8).
- 33.33:16.67 in favour of England for winning the Test Pakistan withdrew (The Oval, 2006 - England 173 and 298 and 4, Pak 504).
Another effective use of the Contribution values is in the area of WTC Table points assignation. The shortcomings of the current assignment of points in the WTC Table are well-known. Without going into details, I have outlined a most effective WTC points structure, especially as the TPP values accurately depict the margins of wins and progress and closeness of draws.
- For a win, assign 8.0 + 4.0 * TPP/100
- For a draw, assign 4.0 + 2.0 * TPP/100
- For a draw, assign 4.0 + 2.0 * TPP/100
Readers can work out the points themselves.
With this background, let me now move on to the tables. The first table is a list of matches in which the winning teams receive in excess of 90 points. A TPP value exceeding 90 points represents a most resounding and comprehensive win.
In Bradman's debut Test, England did not enforce the follow-on, despite a lead of nearly 400, scored a ton of runs, and then dismissed Australia for 66, winning by 675 runs. These numbers could make one's head swirl. England's TPP margin of 94.2-5.8 is the biggest in history. Way back during the days of Test infancy, England scored 292 and then defeated South Africa by an innings and 200-plus runs. That leaves one wondering about the wide chasm in levels, reflected by the TPP comparisons. A few years back, New Zealand won by an even bigger margin against Zimbabwe and secured a 91.1-8.9 win.
Then comes the famous Oval win by England against Australia. Hutton, Leyland, Hardstaff, Bowes, and Barnes railroaded a Bradman-less Australia into abject submission and a 90.7-9.3 win.
Next is the unforgettable Sharjah win of Australia over Pakistan, orchestrated by Matthew Hayden and Shane Warne. Well over a hundred years back, imagine a team winning a match in which it compiled a total of only 400 runs by nearly 300 runs. South Africa was "Lohmanned" to totals of 93 and 30. The TPP margin was an imposing 90.6-9.4.
In the next table, I feature teams that got a bushel-load of points in drawn matches - more than many winning teams.
In 1967, South Africa were two wickets away from a resounding innings win over Australia. A few more overs and they would have won. They secured 74.5 points, meant for a near innings win. Incidentally, the fourth day was lost due to rain. Three decades later, England had reached the exact innings total of South Africa with one wicket left. South Africa needed two more deliveries to win the match. They secured 73.7 points.
The next featured match had a different hue. India finished their two innings 46 ahead of West Indies in Delhi in 1959, but the visitors ran out of time. However, they secured 73.5 points. The next Test almost mirrors the first featured match. England finished 13 runs ahead and had a single wicket left against Australia in Cardiff in 2009. Australia's points tally was just over 73.
In six other drawn Tests, the leading team secured a TPP tally of above 70 points. These follow similar patterns. In most of these Tests, the late-order batters put up spirited stands to save the Tests.
Now on to the match-related tables. The first one relates to the best performances in Tests, based on the contributions analysis. This table is based on the percentage of the total points rather than absolute values, to ensure that the contributions are not unduly influenced by the quantum of win margins.
The player who contributed most in a Test is, not surprisingly, Ian Botham. And no prizes for guessing when and where. At the Wankhede, Botham produced, almost inarguably, the greatest all-round performance in a Test - 114 runs, coming in at 58 for 5, and taking England to 296, and then taking 6 for 58 and 7 for 48 in the two Indian innings. Nothing I say can describe those streaks of brilliance. That secured him 34.8 points out of the team's total of 74.3, a whopping 47%.
Nearly 100 years earlier, Johnny Briggs achieved 39.5 points and 43%, with two bowling performances - 7 for 17 and 8 for 11 against England in Cape Town in 1889.
Then comes that Manchester near-clean-sweep. Jim Laker's 9 for 37 and 10 for 53 against Australia in 1956 fetched him 32.7 points and 39.6%.
In 1998, Muttiah Muralidaran captured 16 English wickets at The Oval and scored 30. These secured him 28.8 points and 38.5% of Sri Lanka's TPP value.
Nearly 120 years back, Billy Bates dominated the MCG Test with an important 55, followed by two seven-wicket hauls. His personal haul of 29.3 points formed 38.3% of England's total.
In this featured lot, there is only one batting-centric performance. Wiaan Mulder's unbeaten 367 in Bulawayo earlier this year (and his three wickets) secured him 30.3 points and 36.6% of South Africa's TPP tally. Most performances in this featured collection are either mind-blowing all-round performances or dominant bowling efforts.
Now onwards to the batter's performances. This time the % values are determined based on the team's batting points.
Mulder secured 23.8 points, which is nearly 60% of his team's batting points. A few more minutes of batting, and he would have certainly crossed 60%. He is just ahead of John Edrich, whose 310 not out against New Zealand at Headingley in 1965 secured him 23.3 points and 58%.
David Warner's magnum opus of 335, against Pakistan in Adelaide in 2019, fetched him 21.4 points and 58%. These are single innings efforts.
Upul Tharanga's masterly 165 out of 316 and quick fifty in the second innings in Bogra in 2006 fetched him 20.7 points and 56.6% respectively.
Finally, Wally Hammond's masterclass of 231 at SCG in 1936 secured him 21.1 points and 56.5%. It can clearly be seen how dominating these innings are. And most are single-innings situations.
We have already seen Briggs' contributions on the bowling front. His 15 for nothing received 38.5 contribution points and accounted for a huge 83.3% of the team bowling contribution. Laker's 19 wickets received 32.5 points and crossed the 80% mark. George Lohmann's Port Elizabeth blitz in 1896 of 7 for 38 and 8 for 7 had numbers 31.5 and 78.0% respectively. Then comes Murali's exploits at The Oval - his 16 wickets clocked 26.9 points and 75.5%. Rounding off the top five in the table is Sydney Barnes' all-time great bowling masterclass of 17 wickets in Johannesburg in 1913. He got 26.6 points and 73.3%. Look at the domination of the bowlers from ages long gone in this table.
I have not shown the table on fielding contributions in view of the high number of tables that need to be shown in the article. Let me mention that Kiran More's six stumpings and one catch in the against West Indies in Chennai in 1988 gathered 2.44 contribution points and is the best fielding effort ever. Alex Carey's haul of nine catches against West Indies in 2022 in Adelaide, gathered 2.29 points. AB de Villiers' 11 catches against Pakistan in Johannesburg in 2013 gathered 2.28 points. Australia's win was by a bigger margin - by 419 runs, against South Africa's win by 211 runs.
2. BAT-100: Batting Performance Analysis
This is the analysis of all the innings in a totally context-centric manner. All aspects of context - relating to the batter, innings, match, bowlers, location, result etc are included. In these analyses, context is everything. The following factors and measures are in play:
- Runs scored
- Balls faced
- Share of team totals
- When were the runs scored - the match status?
- What was the situation at entry?
- At what rate did he score the runs (actual or extrapolated, where balls-faced data is not available)?
- What was the quality of the bowling attack?
- Their career-to-date averages
- What was the nature of the pitch?
- Partnerships that the batter was a part of
- How much support did the batter get?
- Did he add valuable runs with the late-order batters?
- POTM achievements (declared POTM/derived performance)
- How did he compare with his peers (team-mates and batters in match)?
- What was the result?
- Where was the match played?
... and so on.
Just a single table is presented. That lists the top innings of all time. A notional value of 1000 rating points will be allotted to the best Test Batting performance ever - it has not been reached yet, and almost certainly will never be reached.
Kusal Perera leads with 965 points for his magnificent 153 not out in Durban in 2019, followed by Kyle Mayers (907) for his outstanding match-winning 210 in Chattogram in 2021. VVS Laxman's unforgettable 281 in Kolkata against Australia in 2001 fetched him 857 points, while Brian Lara's fourth-innings all-time classic 153 against Australia in Bridgetown in 1999 secured him 849 points.
Ben Stokes' memorable match-winning hundred at Headingley during the 2019 Ashes secured 843 points and completes the top five. Mark Waugh's match-winning 116 in Port Elizabeth in 1997, Neil Harvey's 151 in Durban in 1950, Ollie Pope's recent 196 in Hyderabad, Dennis Amiss' match-saving marathon of 262 in Kingston in 1974 and Botham's all-time-classic at Headingley in the 1981 Ashes round off the top ten.
3. BOW-100: Bowling Performance Analysis
This is the analysis of all the bowling spells in a totally context-centric manner. All aspects of context - relating to the bowler, spell, match, batters, location, result etc are included. In these analyses also, context would be everything. The following factors and measures are in play.
- Wickets captured
- Balls bowled
- Runs conceded
- Batters dismissed
- Their career-to-date averages
- At what scores were batters dismissed?
- When were the wickets captured - the match status?
- What was the quality of the batters?
- Nature of the pitch
- How much support did the bowler get?
- POTM achievements (declared PoM/derived performance)
- How did he compare with his peers (team-mates and bowlers in match)?
- What was the result?
- Where was the match played?
... and so on.
A notional value of 1000 rating points will be allotted to the best Test Bowling performance ever - not yet reached, and almost certainly will never be reached.
Fanie de Villiers leads with 915 points for his magnificent spell of 6 for 43 in Sydney in 1994, followed by Stuart Broad (883) for his opening-day masterclass of 8 for 15 against Australia at Trent Bridge in 2015. Devon Malcolm's spell for the ages - 9 for 57 at The Oval against South Africa in 1994 - secured 881 points. Trevor Bailey's unforgettable 7 for 34 in Kingston in 1954 secured him 877 points. Richard Hadlee's monumental 9 for 52 in Brisbane in 1985 rounds off the top five.
Doug Bracewell's match-winning 6 for 40 in Hobart in 2011, Tom Hartley's 7 for 62 in Hyderabad in 2024, Ajaz Patel's 6 for 57 in Mumbai in 2024, Tony Greig's 8 for 86 in Port-of-Spain in 1974, and the recent Shamar Joseph match-winning 7 for 68 at the Gabba complete the top ten. The bowling points are lower by around 5-8% because the total points are shared by fewer bowlers.
However, what is gratifying is that the highest match aggregate for batting is 1611 points (Kusal Perera in Durban, 2019) and for bowling is 1662 points (Tony Greig in Port-of-Spain in 1974) - within around 3% of each other. This indicates that the batting and bowling points are equalised to a great level.
Because context is all-important, it is possible for a century or four-wicket haul to secure more rating points than a triple-hundred or eight-wicket haul respectively.
4. Match Performance Analysis
By now, it must be clear to all the readers that doing the Match Performance Analysis solely on the basis of either the Contributions or Ratings values is not correct. The former is a solely numbers-based computation exercise and is a clear indicator of who contributed. The latter is a totally context-centric analysis of performances and is a clear indicator of how the players performed. What is required is a combination of the results of both in-depth analyses. A schematic of the concept is presented below.
The visual depiction of MPI analysis is quite clear. The results of the two key analyses are used to compute the Match Performance Index values. The formula I have used is the following. This recognises the fact that the two numbers are worked out to different scales. So they need to be brought down to the same base.
Match Performance Index (MPI) =
(Batting Contribution Points + Bowling/Fielding Contribution Points) + (1.05*Batting Rating Points + 0.95*Bowling Rating Points) / 75.
(Batting Contribution Points + Bowling/Fielding Contribution Points) + (1.05*Batting Rating Points + 0.95*Bowling Rating Points) / 75.
This takes into account the following factors.
- The bowlers tend to get more points than the batters in single matches since they have two innings to bowl in always. The batters bat in only one innings in innings wins and high-wicket wins. Hence the batting Rating points get a 10% higher weight.
- The contribution values do not have this problem since at the top level the points are equalised. The single innings played by the winning team in innings wins carries significantly more points.
- Since the Contribution values are determined based on the over-the-counter values directly obtained from the scorecard, those should carry a higher weight than the complex context-centric Performance Ratings values.
- The dividing factor of 75 means that the highest value of 900-plus points gets a value of around 12 or so. The highest match Batting and Bowling Contribution points get around 18-20 points, which conforms to the above requirements.
- It is clear that there is some overlap between the two processes - in the areas of runs scored, wickets captured, averages, team comparisons etc. However, it really does not matter since these are the important facets of the repertoire of any player. There is nothing wrong fundamentally in the possible double counting. Runs are runs and wickets are wickets, and are the most important deliverables for any player.
- I have considered, and regretfully rejected, the impact of additional responsibilities such as captaincy, wicketkeeping etc, since it is not possible to quantify these responsibilities.
Now, on to the most important tables. The first one lists the best performances, with no caveats whatsoever, in the history of Test cricket.
We come back to that winter week in Bombay. Botham strode the Wankhede Stadium like a colossus. Since Botham's feat has already been chronicled, let me just repeat the numbers: 114 good-as-gold runs, 6 for 58 and 7 for 48. Hadlee's 1984 all-round performance par excellence against England in Christchurch, 99 priceless runs and eight wickets, is in second place with 55 points. In third place is Briggs' bowling double in Cape Town in 1889, which I have already talked about. Those 15 wickets did not need any batting contribution and secured 53.7 points.
In fourth place is Mushtaq Mohammad's Port-of-Spain all-round performance in 1977, arguably the best in Test cricket, since he contributed in all four innings. Bill Bates clocks in fifth position with his MCG exploits in Mlebourne in 1883. Hadlee, this time in Brisbane, Laker, Jadeja, Mushtaq Mohammad again, and Mulder complete the top ten. There are seven all-round performances, two bowling-centric ones, and a single batting-centric performance in this lot. Hadlee and Mushtaq are the players that appear twice in this elite list.
This table highlights the top performances in drawn Tests. Garry Sobers leads with his complete all-round performance in Georgetown against England in 1968. England just about managed to draw the match with a last-wicket partnership. Alan Davidson's equally stirring all-round effort in the first tied Test, in Brisbane in 1961, follows in second place. Carl Hooper's performance in Nagpur in 1994 was no less impressive.
Finally, the great efforts in losing causes. Jason Holder fought like a tiger against Sri Lanka in Barbados in 2018 but could not prevent a close loss. Imran Khan captured eight wickets and scored over 100 runs but could not stop England winning narrowly at Headingley in 1982. Hugh Trumble did everything other than winning in the famous 1902 Oval Test. The brilliance of Jessop and the famous last-wicket stand just about took the edge off Trumble's all-round performances.
Conclusion
As a logical follow-up to this Match Performance Analysis, I will be doing a 360-degree look at the Player-of-the-Match aspect in Test cricket, in my January article. It is a fact that nearly 1700 POTM declarations have been made until now. The other 900 Tests do not have an identification of the notional POTM. I will be using the MPI to do that.
Once that is done, it will be possible to analyse the player performances as far as POTM is concerned. And, I will also look at how many of the POTM awards stand up to scrutiny, when compared to the MPI values. Finally, I will take a critical look at the fascinating double-POTM awards.
Potpourri
This time, the Potpourri section covers certain unusual careers.
Only one player has played a Test and did absolutely nothing in it - really, nothing.
In 1924, Jack MacBryan played for England against South Africa, in a rain-affected match, which lasted less than a single day. He did not bowl a ball nor did he take guard at the crease. Hopefully, he fielded and touched the ball at least a couple of times. He was never selected again. Truly, he did nothing on the cricket field.
One other player did something more.
In 1952, Vijay Rajindernath made his debut for India against Pakistan in Bombay. India won the match by ten wickets. Since they declared their first innings four wickets down, Rajindernath did not bat. Nor did he bat in the second innings. However, being a wicketkeeper, he effected four stumpings. And, obviously, he did not bowl. Why he was not selected for the next two Tests is a mystery. Two other keepers made their debut. And Rajindernath had that single Test to his credit with an average of four dismissals per Test, and that too stumpings.
Twenty-one other players played at least a single Test each, did not bat, but bowled, and some of them captured wickets.
In 1926, Fred Root played three Tests for England, never batted, but took eight wickets. In 2003, Charl Willoughby played two Tests for South Africa and took a single wicket for 125 runs, without once holding the bat. A few months back, Sam Cook made his debut for England, did not bat, but took one wicket in the single Test he played. However, he may play more Tests, bat, and move out of this group of 23.
Talking Cricket Group
Any reader who wishes to join my general-purpose cricket-ideas-exchange group of this name can email me a request for inclusion, providing their name, place of residence, and what they do.
Any reader who wishes to join my general-purpose cricket-ideas-exchange group of this name can email me a request for inclusion, providing their name, place of residence, and what they do.
Email me your comments and I will respond. This email id is to be used only for sending in comments. Please note that readers whose emails are derogatory to the author or any player will be permanently blocked from sending in any feedback in future.
Anantha Narayanan has written for ESPNcricinfo and CastrolCricket and worked with a number of companies on their cricket performance ratings-related systems