How do we rate an ODI century made in 1972 against one made this year?
There are ways to account for the fluctuating value of a hundred in one-dayers
Kartikeya Date
23-Nov-2019
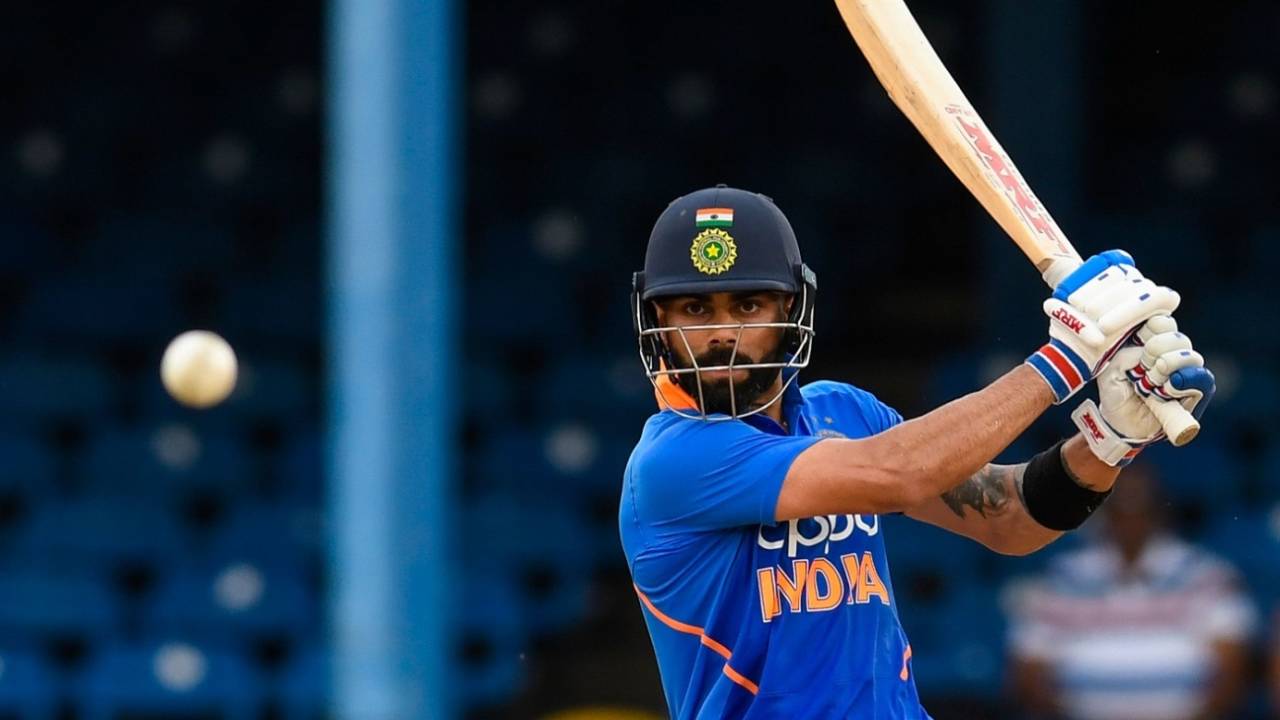
How does the average ODI featuring Virat Kohli today compare to an average ODI involving Viv Richards back in the day? • Getty Images
Virat Kohli recently celebrated his 31st birthday. Only Sachin Tendulkar made more international runs and more international centuries than Kohli has before his 31st birthday. In Test cricket, it's a different story. Alastair Cook (9780 runs in 218 innings) and Tendulkar (9470 runs in 184 innings) lead the pack among players who have scored the most runs at 30 years of age. Kohli, Steven Smith and Joe Root hover around the 7000-run mark. Tendulkar and Kohli lead the table in ODIs at the same stage. Kohli is 1600 runs short of Tendulkar's 13,134 runs when he was 31, but has played 94 fewer innings. He has also made six ODI hundreds more than Tendulkar.
When comparing players of different eras in ODI cricket, we need to reckon with the problem of run inflation. For example, 381 runs were scored in the average ODI in the 1970s. Since 2015, this figure stands at 480. More systematically, consider the 100-match rolling scoring rate in ODI cricket. The earliest 100-match scoring rate is the scoring rate over the first 100 ODI matches. One way to measure run inflation in ODI cricket is to measure how the scoring rate over each subsequent 100-match period compares to this first average. The chart below shows this history.
When Sachin Tendulkar made his ODI debut, scoring-rate inflation stood at 13%. When he retired in 2013, it stood at 28%. Today it stands at 40%.
Inflation in Test cricket has been different. Unlike in ODI cricket, where the contest involves scoring as many runs as possible from a fixed number of overs, the contest in Test cricket involves scoring as many runs as possible before being bowled out. Inflation in Test cricket is best measured as the inflation in the cost of each wicket in terms of runs.
Test cricket in (especially) the 19th century and the first decade of the 20th century was a low-scoring affair compared to what it is today. However, by the 1930s, the cost of each wicket had essentially stabilised. For instance, 1066 runs were scored and 32 wickets taken in the average Test match involving Don Bradman. Eight decades later, the average Test match involving Smith features 1091 runs and 33 wickets, and the average Test match involving Kohli 1047 runs and 32 wickets. Bradman and Smith played the same game in Test cricket.
By contrast, 394 runs were scored and 14 wickets taken in the average ODI involving Viv Richards, while for the average ODI involving Kohli, the corresponding numbers are 490 runs and 14 wickets. The average ODI involving Tendulkar (over a 24-year career spanning significant run inflation, as we have seen above) had 444 runs and 14 wickets. Richards and Kohli did not play the same game.
This suggests that while fitness, equipment, drainage technology, floodlighting and pitch preparation methods have changed, most of the shift in the nature of scoring in cricket occurs due to rule changes. These have been frequent in ODIs (and typically, have been designed to favour the bat over the ball), and very rare in Tests.
One consequence of run inflation is that the difficulty of scoring centuries and half-centuries varies in ODI cricket across eras. It was one thing to score an ODI century in the 1970s and '80s, when the average ODI game featured about 400 runs. It is another to score it in the current era, when the average ODI features 480 runs.
A few years ago, a friend of mine proposed a justification for 100 runs as a good (and non-arbitrary) individual milestone in a Test innings.
Bowlers have five-wicket hauls and ten-wicket hauls. There is a certain logic to this. A bowler who collects five wickets in a Test innings has accounted for at least half the wickets available in the innings. Similarly, a bowler who collects ten wickets in a match has accounted for at least half the wickets available in the Test match. If we assumed that four out of 11 players in a Test team are picked to take wickets and seven out of 11 are picked to contribute runs, then it also follows that a five-wicket haul in an innings is double the average innings haul for a specialist bowler in a Test team.
If the seven batsmen are mainly responsible for providing runs, the average expectation per batsman per innings is n/7, where "n" is the average completed team innings score. Double this expectation would be 2*n/7. Over the history of Test cricket, n comes to 319.6 runs. (2*319.6/7) would be the "century score", if a Test century by a batsman was considered equivalent to a five-wicket haul by a bowler.
One could argue that only the runs scored by the top seven batsmen should be considered. This would be one way to go. But remember, the goal here is to calculate a "century threshold" for the batting team's runs. In other words, assuming that scoring runs is the responsibility of the seven batsmen, what is the equal share of each batsman in achieving a team total? Twice this share should be the "century" threshold.
Over the history of Test cricket, the century score comes to 91.3 runs. If we consider 100-Test spans, as before, then the century score has fluctuated between 85 and 105 runs for the most part over the last 80 years. Note that if we considered 200-Test spans, these fluctuations would be less pronounced, but they would still hover around the 91.3-run mark.
This century score can also be used to account for the batting strength of a player's team. For example, for Australian sides Ricky Ponting played in, the century score was 118. For Indian sides Tendulkar played in, it was 106. For sides Kohli has been in, it is 104. For sides Smith played in, it stands at 102, while for sides Brian Lara played in it stands at 85, and for sides Shivnarine Chanderpaul played in, it stands at 87.
In ODIs, we need to keep in mind that the maximum length of an ODI innings is predetermined. If seven batsmen are considered responsible for providing the runs, then each is responsible for facing a fraction under 43 balls in a 300-ball innings. Using the (2*n/7) proposition, a century score therefore, would be the the runs scored by a batsman over 86 balls (2*300/7). With this approach, when Tendulkar made his debut, an ODI century score was 65. By the time he had retired, this had increased to 74 runs. Today, it stands at 81. The chart below shows this historical progression over a 100-match rolling average.
Using this approach for individual players, over the course of Tendulkar's career, the century score for India was 72. Over Kohli's career so far it is 81. Over Richards' career it was 65. Overall, 47 ODI batsmen have scored more than ten ODI hundreds each. The table below gives the number of centuries scored by each of these players as well as the century score. Tendulkar made 49 hundreds and 92 century scores (of 72 and over) in 452 ODI innings. As opener, Tendulkar made 82 century scores in 340 innings, and 45 scores of 100 or more.
This is a way to understand inflation in ODI cricket. Under this system of adjusting for inflation, Kohli has 60 ODI century scores in 230 innings, while Rohit Sharma has 31 ODI century scores in 132 innings as opener. Sourav Ganguly made 46 century scores in 236 innings as opener.
It is evident that the century threshold in Tests is higher for batsmen in strong teams and lower for batsmen in weak teams. Further, it is naturally higher in batting-friendly eras (such as the 2000s) compared to other eras (such as the 19th century). In ODIs, the threshold is higher in the same era for teams that tend to play more high-scoring games (the century score for Root's teams is 85) than others (Babar Azam, 80). The century is an individual batting threshold. It signifies an achievement in an individual innings. How hard or easy it is for a batsman to make a century score depends on the opposition bowling and on the quality of batting partners available to the batsman. A strong batting partner increases the likelihood of a stand, and as stands get longer, opponents are forced to defend more and use their less fancied bowlers. All this makes run accumulation easier. In ODIs, having a strong partner eases the pressure of having to maintain a scoring rate.
Should centuries be measured in this way? There are a couple of arguments for it. First, this method accounts of the vagaries of each era. Test cricket appears to be entering a bowler's era and centuries will be harder to come by in the near future than they were in the first decade of this century. This approach would account for these effects. Second, it would eliminate the century as a milestone and make it a retrospective calculation. This way, batsmen could avoid the contrivance of having missed a predetermined milestone. Should century scores be specific to a player's career (as I've presented them here), or should they be specific to an era? This is a question for cricket statisticians.
Kartikeya Date writes at A Cricketing View. @cricketingview