Pace, bounce, quick runs, and Mitchell Johnson
Stats preview to the Perth Test, where England have lost each of their last six Tests
S Rajesh
12-Dec-2013
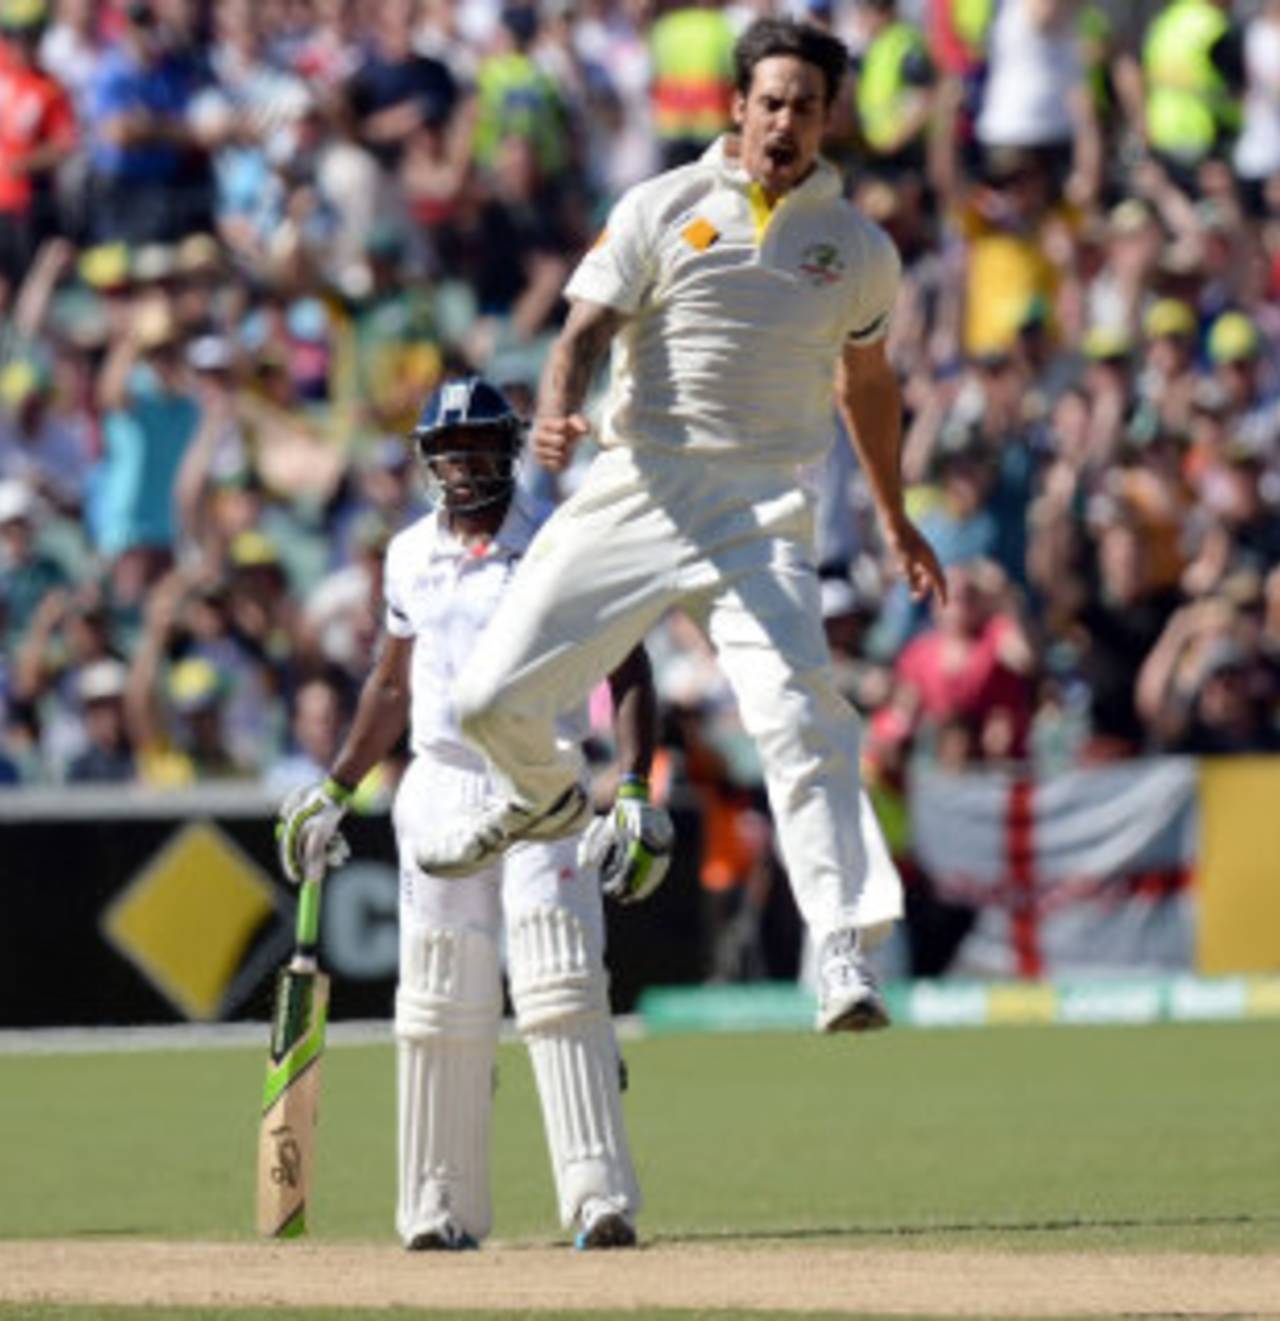
Mitchell Johnson has taken 36 wickets in five Tests in Perth, and has never taken less than five wickets in a Test here • PA Photos
England haven't beaten Australia in a Perth Test since 1978, and even that wasn't worth a regular Test win as Australia's main players were away doing Kerry Packer duty. Since then they've lost seven out of nine Tests, and each of the last six, at this venue; in those last six Tests here, they've averaged less than 21 runs per wicket with the bat and conceded almost 38 with the ball. Their last three defeats have been by margins of an innings and 48 runs (2002), 206 runs (2006) and 267 runs (2010). Given that England must avoid defeat to stay in the Ashes, these are not encouraging stats.
Australia have been unstoppable here against England, but their overall recent results here aren't quite as daunting, which is what Alastair Cook and Co will need to remember as they go into the Perth Test. Since 2006, Australia only have a 4-3 win-loss record here, with two defeats against South Africa and one against India offset by wins against England (twice), India and West Indies. In 2008, Australia lost twice in Perth: against an Indian team which was also trailing 2-0 in the series, they were beaten by 72 runs, while South Africa chased down a target of 414 for the loss of only four wickets later that year. Their most recent Test there also ended in defeat, by 309 runs against South Africa. In 2009 they beat a fairly ordinary West Indies side by only 35 runs, but that was followed by two emphatic results - a 267-run hammering of England, and an-innings-and-37-run win against an abject Indian team.
In these last seven Tests, Australia's batting average is only slightly more than their bowling average, but what's worrying for England is how poor their batsmen have been in the last six Tests here. Only two centuries have been scored by them during this period - 123 by Graham Thorpe in 1995 and 116 by Cook in 2006 - and there are only two other scores of more than 75. England's three top-order batsmen who've played Tests here - Cook, Kevin Pietersen and Ian Bell - have all got starts and a venue average of around 40, but none of them have imposed themselves on a match.
Apart from their poor record in Perth, England also have the baggage of the series scoreline to play against. After being thrashed in Brisbane and Adelaide, England need to win two out of three Tests to retain the Ashes. Only once have England recovered from a two-match deficit and levelled a series against any opposition: in 1954 in the West Indies, England lost the first two Tests by 140 and 181 runs, but won the third and the fifth by nine wickets to draw the series.
| Team (period) | Tests | W/ L | Ratio | Bat ave | Bowl ave |
| Australia (overall) | 40 | 23/ 10 | 2.30 | 37.16 | 28.44 |
| England (overall) | 12 | 1/ 8 | 0.12 | 26.67 | 36.09 |
| Australia (since 1990) | 23 | 15/ 5 | 3.00 | 39.81 | 26.85 |
| England (since 1990) | 6 | 0/ 6 | 0.00 | 20.59 | 37.72 |
| Australia (since 2006) | 7 | 4/ 3 | 1.33 | 33.75 | 29.51 |
Australia's top order hasn't been outstanding here either. Michael Clarke has played 15 innings here but scored only one century - 135 not out against England in 2006. In his last four Tests here, Clarke has scored a total of 127 runs in seven innings, at an average of 18.14.
| Batsman | Tests | Runs | Average | 100s/ 50s |
| Michael Clarke | 8 | 518 | 37.00 | 1/ 2 |
| Brad Haddin | 4 | 311 | 44.42 | 0/ 3 |
| Shane Watson | 3 | 262 | 43.66 | 0/ 2 |
| David Warner | 2 | 222 | 74.00 | 1/ 0 |
| Mitchell Johnson | 5 | 208 | 26.00 | 0/ 2 |
When the venue is the WACA, the central topic of discussion is invariably fast bowling, but the table below shows that overseas spinners have performed as well as their fast bowlers in the last seven Tests. Among the overseas spinners, the left-arm ones have done pretty well: Monty Panesar took eight in the match in 2006, while Robin Peterson, Paul Harris and Sulieman Benn have all taken four or more in a Test. Among the overseas fast bowlers, Chris Tremlett had a superb game in 2010 with match figures of 8 for 150, while Dale Steyn has 11 from two Tests at an average of 24.90.
For Australia, though, fast bowling has been by far their most potent weapon here: they've taken 114 out of 127 bowler wickets in the last seven Tests here, at an average of less than 26; spinners have gone for almost 60 runs per wicket.
What's also noticeable is the rate at which bowlers have conceded runs at this ground. Batsmen have often said that this is an excellent venue for run-scoring once a batsman has adjusted to the pace and bounce, and the stats confirm this: bowlers overall have conceded 3.51 runs per over at the WACA in Tests since 2006, the highest among venues which have hosted at least five Tests during this period.
| Wickets | Average | Strike rate | Econ rate | 5WI/ 10WM | |
| Aus pace | 114 | 25.63 | 48.1 | 3.19 | 5/ 1 |
| Aus spin | 13 | 59.76 | 96.1 | 3.72 | 0/ 0 |
| Others - pace | 88 | 33.44 | 53.9 | 3.72 | 2/ 0 |
| Others - spin | 34 | 32.05 | 49.5 | 3.88 | 1/ 0 |
Among the Australian fast bowlers, Mitchell Johnson's stats in Perth stand out. In five Tests he has 36 wickets at an average of 19.66, and a wicket every 33 balls. At all the other venues, he averages 31.45, and takes a wicket every 57 balls. The fewest number of wickets he has taken in a Test here is five, while against England in 2010 he returned match figures of 9 for 82.
The other bowler who destroyed England in 2010 was Ryan Harris, who had match figures of 9 for 106. He didn't do too much in his only other Test, against India in 2012, but his Perth average is still an outstanding 15.72, at a strike rate of 32.7 deliveries per wicket.
| Bowler | Tests | Wickets | Average | Strike rate | Econ rate | 5WI/ 10WM |
| Mitchell Johnson | 5 | 36 | 19.66 | 33.6 | 3.50 | 2/ 1 |
| Ryan Harris | 2 | 11 | 15.72 | 32.7 | 2.88 | 1/ 0 |
| Peter Siddle | 3 | 8 | 30.75 | 62.3 | 2.95 | 0/ 0 |
Perth's a pitch for fast bowling, but it isn't usually a venue where teams prefer to bowl first: five of the last seven Tests have been won by the team batting first. The two instances when the team batting first lost the Test were Australia against South Africa in 2008, and India in 2012, when they were bowled out for 161 and lost by an innings and 37 runs. Overall in the last seven Tests, teams batting first have averaged almost 32 runs per wicket in their first innings, while the average has dropped to 25 for the second innings of the Test. It goes back up into the mid-30s for the last two innings.
| 1st innings | 2nd innings | 3rd innings | 4th innings |
| 31.68 | 24.84 | 35.98 | 34.66 |
S Rajesh is stats editor of ESPNcricinfo. Follow him on Twitter