ESPNcricinfo Awards 2009: Sehwag, Dilshan, Johnson take Statsguru prizes
The players of 2009, as decided by the numbers, in the list of Statsguru Awards winners
S Rajesh
Feb 19, 2010, 1:54 PM
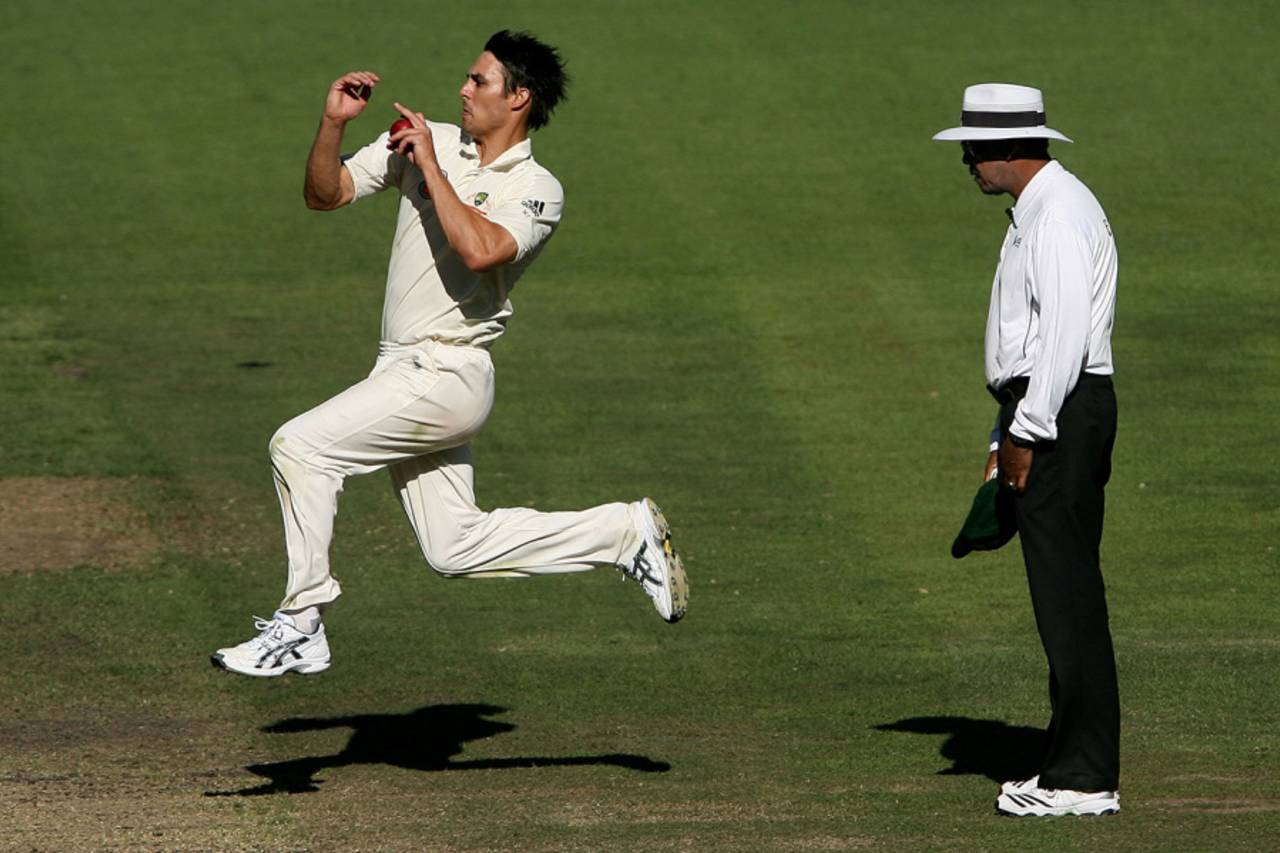
Johnson: Best Test Bowler, runner-up in the Bowler of the Year stakes, and best Test strike rate • Robert Prezioso/Getty Images
The Statsguru Awards are based purely on numbers, from international matches in 2009. However, they go beyond the usual stats - runs scored, wickets taken, batting averages and such - and are based instead on detailed data analyses of performances. Which batsman played more consistently than any other over the entire year? Which batting pair was the most prolific through the year? Which bowler was at his best in the third and fourth innings of Tests? Read on to find out more.
Main awards
Batsman of the year
(cut-off: 700 runs each in Tests and ODIs)
(cut-off: 700 runs each in Tests and ODIs)
It was an amazing year for Gambhir in both forms of the game. In the five Tests he played, Gambhir scored four hundreds, including a monumental, match-saving 137 in Napier, which consumed 643 minutes. In 23 ODI innings he twice touched 150, finishing with an average of 40.38 at a strike rate of 92.57. Multiplying the ODI average by the runs scored per ball gives him the batting index of 37.38. Adding the Tests average to that, his total score for the year comes to 128.25.
Two other names deserve mention: Tillakaratne Dilshan did superbly in both formats as well, finishing with a Test batting average of 64.52 and an ODI index of 57.32 (average 55.55, strike rate 103.19), giving him a total score of 121.84. Australia's Shane Watson shone in both forms too, with a Test average of 65.09 and an ODI index of 40.65.
Bowler of the year
(cut-off: 30 wickets each in Tests and ODIs)
(cut-off: 30 wickets each in Tests and ODIs)
It wasn't a great year for bowlers in general, but Broad established himself firmly as one to look out for. In 14 Tests he took 47 wickets with three five-fors, including five-fors in successive Tests during the Ashes. He was just as effective in ODIs, with 32 wickets in 15 games at an average of 22.84 and economy rate of 5.64. (Multiplying the average by the runs conceded per ball gives the ODI index).
Broad faced stiff competition from fast-bowling mate James Anderson (total score 53.43) and Australia's Mitchell Johnson (54.12), but remained on top. Anderson was let down by a relatively high Test bowling average (33.87), while Johnson's ODI average of 30.11 was below par.
Best Test batsman
(cut-off: 700 runs)
(cut-off: 700 runs)
Gautam Gambhir
Gambhir played only five Tests, but scored 727 runs at an average of 90.87. He struck four hundreds, the joint second-highest for the year - only Dilshan, with six, had more. Rahul Dravid averaged 83 with seven 50-plus scores in six Tests, while Thilan Samaraweera, the highest run-getter for the year with 1234, averaged 72.58.
Gambhir played only five Tests, but scored 727 runs at an average of 90.87. He struck four hundreds, the joint second-highest for the year - only Dilshan, with six, had more. Rahul Dravid averaged 83 with seven 50-plus scores in six Tests, while Thilan Samaraweera, the highest run-getter for the year with 1234, averaged 72.58.
Most consistent batsman
(cut-off: 700 runs)
(cut-off: 700 runs)
Shane Watson - Consistency index 2.00
He missed out on several Test centuries in 2009, but that also meant Watson consistently scored half-centuries - he had six of them in 12 innings. He average for the year was an excellent 65.09, and the fact that he did it with just one century gave him a very low standard deviation - which measures the average distance from the mean - of 32.50. Combined with his average, it gave him a consistency index (average divided by standard deviation) of 2.00.
He missed out on several Test centuries in 2009, but that also meant Watson consistently scored half-centuries - he had six of them in 12 innings. He average for the year was an excellent 65.09, and the fact that he did it with just one century gave him a very low standard deviation - which measures the average distance from the mean - of 32.50. Combined with his average, it gave him a consistency index (average divided by standard deviation) of 2.00.
Rahul Dravid had a high consistency index of 1.64, thanks to six fifties in 10 innings, but for Ramnaresh Sarwan it was 0.81 - he made four centuries and a 94, but also had six innings of fewer than 15.
Best Test bowler
(cut-off: 30 wickets)
(cut-off: 30 wickets)
Mitchell Johnson
The bowler who took the most wickets in 2009 also took them at the best average. Johnson picked up 63 in 13 Tests at 27.42, marginally ahead of Graeme Swann, who averaged 27.92 for his 54 scalps. A bigger surprise was a legendary spinner who didn't even make the 30-wicket cut: Muttiah Muralitharan picked up 26 wickets in eight Tests, with each one costing him 45.96.
The bowler who took the most wickets in 2009 also took them at the best average. Johnson picked up 63 in 13 Tests at 27.42, marginally ahead of Graeme Swann, who averaged 27.92 for his 54 scalps. A bigger surprise was a legendary spinner who didn't even make the 30-wicket cut: Muttiah Muralitharan picked up 26 wickets in eight Tests, with each one costing him 45.96.
Best ODI batsman
(cut-off: 700 runs against all Test-playing teams excluding Zimbabwe)
(cut-off: 700 runs against all Test-playing teams excluding Zimbabwe)
Virender Sehwag
His ODI career had been relatively quiet before last year, but in 2009 he absolutely rocked with the bat, averaging 45 at a strike rate of more than 136. Multiplying the average by the average runs per ball gave him a batting factor of 61.46, marginally ahead of MS Dhoni's 60.30 (average 70.47, strike rate 85.57). Dilshan, the only batsman apart from Sehwag with a strike rate of more than 100, came in third with an average of 55.55 and a strike rate of 103.19).
His ODI career had been relatively quiet before last year, but in 2009 he absolutely rocked with the bat, averaging 45 at a strike rate of more than 136. Multiplying the average by the average runs per ball gave him a batting factor of 61.46, marginally ahead of MS Dhoni's 60.30 (average 70.47, strike rate 85.57). Dilshan, the only batsman apart from Sehwag with a strike rate of more than 100, came in third with an average of 55.55 and a strike rate of 103.19).
Best ODI bowler
(cut-off: 30 wickets, excluding matches involving Zimbabwe and other non-Test-playing teams)
(cut-off: 30 wickets, excluding matches involving Zimbabwe and other non-Test-playing teams)
James Anderson
In 19 matches, Anderson took 34 wickets at an average of 23.61 and an economy rate of 4.97, which gave him an ODI bowling index of 19.56. That put him ahead of Broad, who'd edged past him in the overall bowler ratings. Broad was second here with an index of 21.47 (average 22.84, economy rate 5.64), while Australia's Nathan Hauritz finished third with an index of 21.53 (average 29.76, economy rate 4.34).
In 19 matches, Anderson took 34 wickets at an average of 23.61 and an economy rate of 4.97, which gave him an ODI bowling index of 19.56. That put him ahead of Broad, who'd edged past him in the overall bowler ratings. Broad was second here with an index of 21.47 (average 22.84, economy rate 5.64), while Australia's Nathan Hauritz finished third with an index of 21.53 (average 29.76, economy rate 4.34).
****
Other awards
Test batting
(Cut-off: 700 runs, unless mentioned otherwise)
(Cut-off: 700 runs, unless mentioned otherwise)
Batting pairs of the year: openers
(Cut-off: eight innings)
(Cut-off: eight innings)
Simon Katich and Shane Watson
Neither is a specialist opener, but Katich and Watson did the job better than anyone else in 2009. On the 12 occasions when they opened the innings, they averaged 71.33 per partnership, with six 50-plus partnerships. They pipped the Indian pair of Gambhir and Sehwag, who averaged 66.25 in eight innings. At the bottom of the pile was the New Zealand pair of Martin Guptill and Tim McIntosh, who batted together 12 times but averaged a meagre 15.75.
Neither is a specialist opener, but Katich and Watson did the job better than anyone else in 2009. On the 12 occasions when they opened the innings, they averaged 71.33 per partnership, with six 50-plus partnerships. They pipped the Indian pair of Gambhir and Sehwag, who averaged 66.25 in eight innings. At the bottom of the pile was the New Zealand pair of Martin Guptill and Tim McIntosh, who batted together 12 times but averaged a meagre 15.75.
Batting pairs of the year: others
(Cut-off: eight innings)
(Cut-off: eight innings)
Mahela Jayawardene and Thilan Samaraweera
Jayawardene batted with Samaraweera in eight Test innings in 2009, and scored exactly 1000 runs at an average of 142.85. Their stands included a mammoth one of 437 for the fourth wicket against Pakistan in Karachi, which is a record for that wicket. Their list of partnerships read as follows: 437, 11*, 19, 166, 180, 39, 138, 10. They were so far ahead of the field that the second-best pair, Australia's Marcus North and Brad Haddin, averaged half that number: 71.62, in eight partnerships. The most incompatible pair of the year was also from Australia - Michael Clarke and Michael Hussey averaged 27.35 in 14 innings.
Jayawardene batted with Samaraweera in eight Test innings in 2009, and scored exactly 1000 runs at an average of 142.85. Their stands included a mammoth one of 437 for the fourth wicket against Pakistan in Karachi, which is a record for that wicket. Their list of partnerships read as follows: 437, 11*, 19, 166, 180, 39, 138, 10. They were so far ahead of the field that the second-best pair, Australia's Marcus North and Brad Haddin, averaged half that number: 71.62, in eight partnerships. The most incompatible pair of the year was also from Australia - Michael Clarke and Michael Hussey averaged 27.35 in 14 innings.
Highest percentage of team runs
Ross Taylor
This one's an unlikely winner - Taylor scored 782 runs in 2009, which is 18.19% of New Zealand's total runs scored in the year. The leading run-scorer of the year, Samaraweera, scored 17.22% of Sri Lanka's total runs as Sri Lanka had several high-scoring batsmen in 2009 - of the top six leading run-getters, four were Sri Lankans.
This one's an unlikely winner - Taylor scored 782 runs in 2009, which is 18.19% of New Zealand's total runs scored in the year. The leading run-scorer of the year, Samaraweera, scored 17.22% of Sri Lanka's total runs as Sri Lanka had several high-scoring batsmen in 2009 - of the top six leading run-getters, four were Sri Lankans.
Most runs in wins
(cut-off: 400 runs in wins)
(cut-off: 400 runs in wins)
Tillakaratne Dilshan
Dilshan scored 652 runs in the Tests that Sri Lanka won in 2009, at an exceptional average of 81.50. Katich, Samaraweera and Clarke were the only others who scored more than 500 runs in wins.
Dilshan scored 652 runs in the Tests that Sri Lanka won in 2009, at an exceptional average of 81.50. Katich, Samaraweera and Clarke were the only others who scored more than 500 runs in wins.
Best strike rate
Tillakaratne Dilshan
Sehwag had a strike rate of 108.98, but he failed to make the 700-run cut, scoring only 631 runs, thanks to the few Tests India played in the year. Dilshan averaged more than 64 in the 11 Tests he played, but more impressively, scored at a strike rate of 82.66. Next was England's Matt Prior, with a strike rate of 72.69, while Chris Gayle scored at 67.73 per 100 balls.
Sehwag had a strike rate of 108.98, but he failed to make the 700-run cut, scoring only 631 runs, thanks to the few Tests India played in the year. Dilshan averaged more than 64 in the 11 Tests he played, but more impressively, scored at a strike rate of 82.66. Next was England's Matt Prior, with a strike rate of 72.69, while Chris Gayle scored at 67.73 per 100 balls.
Highest percentage of runs in boundaries
Ross Taylor
Taylor struck nine sixes and 106 fours in the 782 runs he scored, a percentage of 61.13. Gayle was next at 59% (18 sixes and 82 fours in 739), while Watson had a percentage of 57.26. At the bottom of the pile was Paul Collingwood, with a percentage of just 39.78 (88 fours and two sixes in a tally of 915).
Taylor struck nine sixes and 106 fours in the 782 runs he scored, a percentage of 61.13. Gayle was next at 59% (18 sixes and 82 fours in 739), while Watson had a percentage of 57.26. At the bottom of the pile was Paul Collingwood, with a percentage of just 39.78 (88 fours and two sixes in a tally of 915).
Test bowling
(cut-off: 30 wickets)
(cut-off: 30 wickets)
Best strike rate
Mitchell Johnson
Johnson was the clear leader here, with a wicket every 47.8 deliveries, which gave him his second Statsguru Award of 2009. In second place was Broad, with a strike rate of 53.8, while Graeme Swann was third with 57.5.
Johnson was the clear leader here, with a wicket every 47.8 deliveries, which gave him his second Statsguru Award of 2009. In second place was Broad, with a strike rate of 53.8, while Graeme Swann was third with 57.5.
Best spinner
Swann and Sri Lanka's Rangana Herath were the only spinners who made the 30-wicket cut-off, and Swann easily had the better record for the year, taking 54 wickets in 12 Tests at 27.92, while Herath's 34 wickets cost him 33.82 each. Even if the cut-off is lowered to 25 wickets, Swann's average is still the best, with Harbhajan Singh's 30.17 in second place.
Best third- and fourth-innings bowler
(cut-off: 15 wickets)
(cut-off: 15 wickets)
Harbhajan Singh
For the second year running Harbhajan took this award, taking 15 fourth-innings wickets at an average of 20. Herath was next, with 21 wickets at 24.14, while Johnson's 28 wickets came at 26.10.
For the second year running Harbhajan took this award, taking 15 fourth-innings wickets at an average of 20. Herath was next, with 21 wickets at 24.14, while Johnson's 28 wickets came at 26.10.
ODI batting
(Cut-off: 700 runs, unless mentioned otherwise)
(Cut-off: 700 runs, unless mentioned otherwise)
Best strike rate
Virender Sehwag
In the 593 balls he faced in ODIs in 2009, Sehwag scored 810 runs, giving him a strike rate of 136.59 runs per 100 balls, easily the highest of the year. Dilshan was the only other batsman with a strike rate of more than 100, scoring at 103.19 in his 19 innings for a tally of exactly 1000 runs from 969 balls.
In the 593 balls he faced in ODIs in 2009, Sehwag scored 810 runs, giving him a strike rate of 136.59 runs per 100 balls, easily the highest of the year. Dilshan was the only other batsman with a strike rate of more than 100, scoring at 103.19 in his 19 innings for a tally of exactly 1000 runs from 969 balls.
Lowest strike rate
Michael Clarke
Clarke has an overall ODI strike rate of more than 77, but in 2009 it dropped to 69.77, as he scored 852 runs in 1221 balls. In 22 innings he struck just one six. He was also the only one, among the 15 batsmen who scored more than 700 runs, with a strike rate of less than 80. Brendon McCullum, who was the next lowest, had a strike rate of 80.21.
Clarke has an overall ODI strike rate of more than 77, but in 2009 it dropped to 69.77, as he scored 852 runs in 1221 balls. In 22 innings he struck just one six. He was also the only one, among the 15 batsmen who scored more than 700 runs, with a strike rate of less than 80. Brendon McCullum, who was the next lowest, had a strike rate of 80.21.
Batting pairs of the year: openers
(cut-off: at least eight innings)
(cut-off: at least eight innings)
Brendon McCullum and Jesse Ryder
In 11 innings this New Zealand pair put together 519 runs at an average of 47.18 and a scoring rate of 6.15 runs per over, giving them a partnership index score (average stand multiplied by runs per ball) of 48.36. India's Sehwag and Tendulkar were next, with an index score of 44.22 (average 40.20 at a scoring rate of 6.60 runs per over).
In 11 innings this New Zealand pair put together 519 runs at an average of 47.18 and a scoring rate of 6.15 runs per over, giving them a partnership index score (average stand multiplied by runs per ball) of 48.36. India's Sehwag and Tendulkar were next, with an index score of 44.22 (average 40.20 at a scoring rate of 6.60 runs per over).
Batting pairs of the year: others
(cut-off: at least eight innings)
(cut-off: at least eight innings)
Dhoni and Suresh Raina batted together 12 times in ODIs in 2009, and they were involved in three century stands, averaging 67.22 per partnership at a rate of 6.70 runs per over. That gave them a partnership index score of 75.06, which was slightly better than Dilshan and Sangakkara's 70.68 (670 runs at an average of 67 and a run rate of 6.33).
Highest percentage of runs in boundaries
Virender Sehwag
Sehwag struck 114 fours and 20 sixes in ODIs in 2009, thus scoring 576 out of 810 runs in boundaries. That translates into a percentage of 71.11, easily the highest of the batsmen who scored 700 or more runs in the year. Yuvraj Singh is next with 61.08% runs in boundaries, while Dhoni is the least of the lot, with an incredibly low percentage of 35.39: of the 1198 runs he scored, only 424 came in fours (79) and sixes (18).
Sehwag struck 114 fours and 20 sixes in ODIs in 2009, thus scoring 576 out of 810 runs in boundaries. That translates into a percentage of 71.11, easily the highest of the batsmen who scored 700 or more runs in the year. Yuvraj Singh is next with 61.08% runs in boundaries, while Dhoni is the least of the lot, with an incredibly low percentage of 35.39: of the 1198 runs he scored, only 424 came in fours (79) and sixes (18).
Lowest dot-ball percentage
Michael Hussey
Hussey pips de AB de Villiers in this one by the narrowest of margins: Hussey had a dot-ball percentage of 42.37, while de Villiers was marginally behind at 42.95. Gambhir and Sehwag did very well too on this count, especially considering the fact that openers generally play more dot-balls due to close-set fields. Sehwag had a dot-ball percentage of 43.17, while for Gambhir it was 44.98. The highest dot-ball percentage belonged to McCullum (57.80%), who edged out Clarke (57%).
Hussey pips de AB de Villiers in this one by the narrowest of margins: Hussey had a dot-ball percentage of 42.37, while de Villiers was marginally behind at 42.95. Gambhir and Sehwag did very well too on this count, especially considering the fact that openers generally play more dot-balls due to close-set fields. Sehwag had a dot-ball percentage of 43.17, while for Gambhir it was 44.98. The highest dot-ball percentage belonged to McCullum (57.80%), who edged out Clarke (57%).
Highest percentage of runs
AB de Villiers
South Africa scored 3883 ODI runs, of which de Villiers' contribution was 706, a percentage of 18.18. He scored those runs at an average of 58.83 and a strike rate of 93.01. Next in line was Dhoni, who scored 16.52% of India's total runs.
South Africa scored 3883 ODI runs, of which de Villiers' contribution was 706, a percentage of 18.18. He scored those runs at an average of 58.83 and a strike rate of 93.01. Next in line was Dhoni, who scored 16.52% of India's total runs.
Highest percentage of runs in wins
(cut-off: 400 runs)
(cut-off: 400 runs)
AB de Villiers
de Villiers wins this one too, with 538 runs in ODI wins out of South Africa's 2362 in these matches, with a percentage of 22.78. de Villiers performed exceptionally in wins, averaging 107.60 at a strike rate of 102.67 in eight matches. McCullum is next, with a percentage of 20.01.
de Villiers wins this one too, with 538 runs in ODI wins out of South Africa's 2362 in these matches, with a percentage of 22.78. de Villiers performed exceptionally in wins, averaging 107.60 at a strike rate of 102.67 in eight matches. McCullum is next, with a percentage of 20.01.
ODI bowling
(cut-off: 150 overs)
(cut-off: 150 overs)
Best economy rate
Saeed Ajmal
Pakistan's Ajmal bowled 152.1 overs and conceded only 604 runs, an economy rate of 3.96. He was the only bowler who bowled more than 150 overs and had an economy rate of less than four. Daniel Vettori was exceptional too, with an economy rate of 4.06.
Pakistan's Ajmal bowled 152.1 overs and conceded only 604 runs, an economy rate of 3.96. He was the only bowler who bowled more than 150 overs and had an economy rate of less than four. Daniel Vettori was exceptional too, with an economy rate of 4.06.
Worst economy rate
Ishant Sharma
In 153.5 overs, Ishant Sharma leaked 969 runs, an economy rate of 6.29. He was the only bowler to concede more than a run per ball. Ashish Nehra was close, with an economy rate of 5.92.
In 153.5 overs, Ishant Sharma leaked 969 runs, an economy rate of 6.29. He was the only bowler to concede more than a run per ball. Ashish Nehra was close, with an economy rate of 5.92.
Best dot-ball percentage
Nuwan Kulasekara
Sri Lanka's Kulasekara won this one with a dot-ball percentage of 62.01, with Anderson next at 59.34 and Vettori third at 57.64.
Sri Lanka's Kulasekara won this one with a dot-ball percentage of 62.01, with Anderson next at 59.34 and Vettori third at 57.64.
Lowest boundary percentage
Saeed Ajmal
Ajmal wins this one too, conceding only 33 fours and five sixes in 913 deliveries, a percentage of 4.16. Nathan Hauritz is next at 5.01, with Afridi third with a percentage of 5.22.
Ajmal wins this one too, conceding only 33 fours and five sixes in 913 deliveries, a percentage of 4.16. Nathan Hauritz is next at 5.01, with Afridi third with a percentage of 5.22.
Team
Most dominant: Tests
India
India played only six Tests in 2009, but won three of those convincingly - two by an innings and one by 10 wickets - which gave them the highest differential between their batting and bowling averages: their batting average was 20.45 more than their bowling average. Australia were next with a differential of 9.42.
India played only six Tests in 2009, but won three of those convincingly - two by an innings and one by 10 wickets - which gave them the highest differential between their batting and bowling averages: their batting average was 20.45 more than their bowling average. Australia were next with a differential of 9.42.
Most dominant: ODIs
India
Among teams who played more than five ODIs (excluding games against Zimbabwe and non-Test-playing sides), India had the best win-loss ratio, winning 17 and losing 10. They also had the highest differential between the batting index (average multiplied by run rate) and bowling index (average multiplied by economy rate). The differential for India was 9.01, while South Africa was next with 5.67.
Among teams who played more than five ODIs (excluding games against Zimbabwe and non-Test-playing sides), India had the best win-loss ratio, winning 17 and losing 10. They also had the highest differential between the batting index (average multiplied by run rate) and bowling index (average multiplied by economy rate). The differential for India was 9.01, while South Africa was next with 5.67.
Most disciplined: ODIs
New Zealand
In the 24 ODIs they played in 2009, New Zealand conceded only 203 extras, an average of 8.46 per match, which was the lowest among all teams. India and Bangladesh were next, with 11.4 extras each per match. New Zealand also had the biggest differential between extras gained while batting and extras conceded in the field - they got 341 and conceded 203, a difference of 138.
In the 24 ODIs they played in 2009, New Zealand conceded only 203 extras, an average of 8.46 per match, which was the lowest among all teams. India and Bangladesh were next, with 11.4 extras each per match. New Zealand also had the biggest differential between extras gained while batting and extras conceded in the field - they got 341 and conceded 203, a difference of 138.
All ODI stats exclude matches involving Zimbabwe and other non-Test-playing teams.
S Rajesh is stats editor of Cricinfo