From pup to top dog
A century in his 50th Test has only confirmed that Michael Clarke has risen more than a few notches over the last three years
S Rajesh
07-Aug-2009
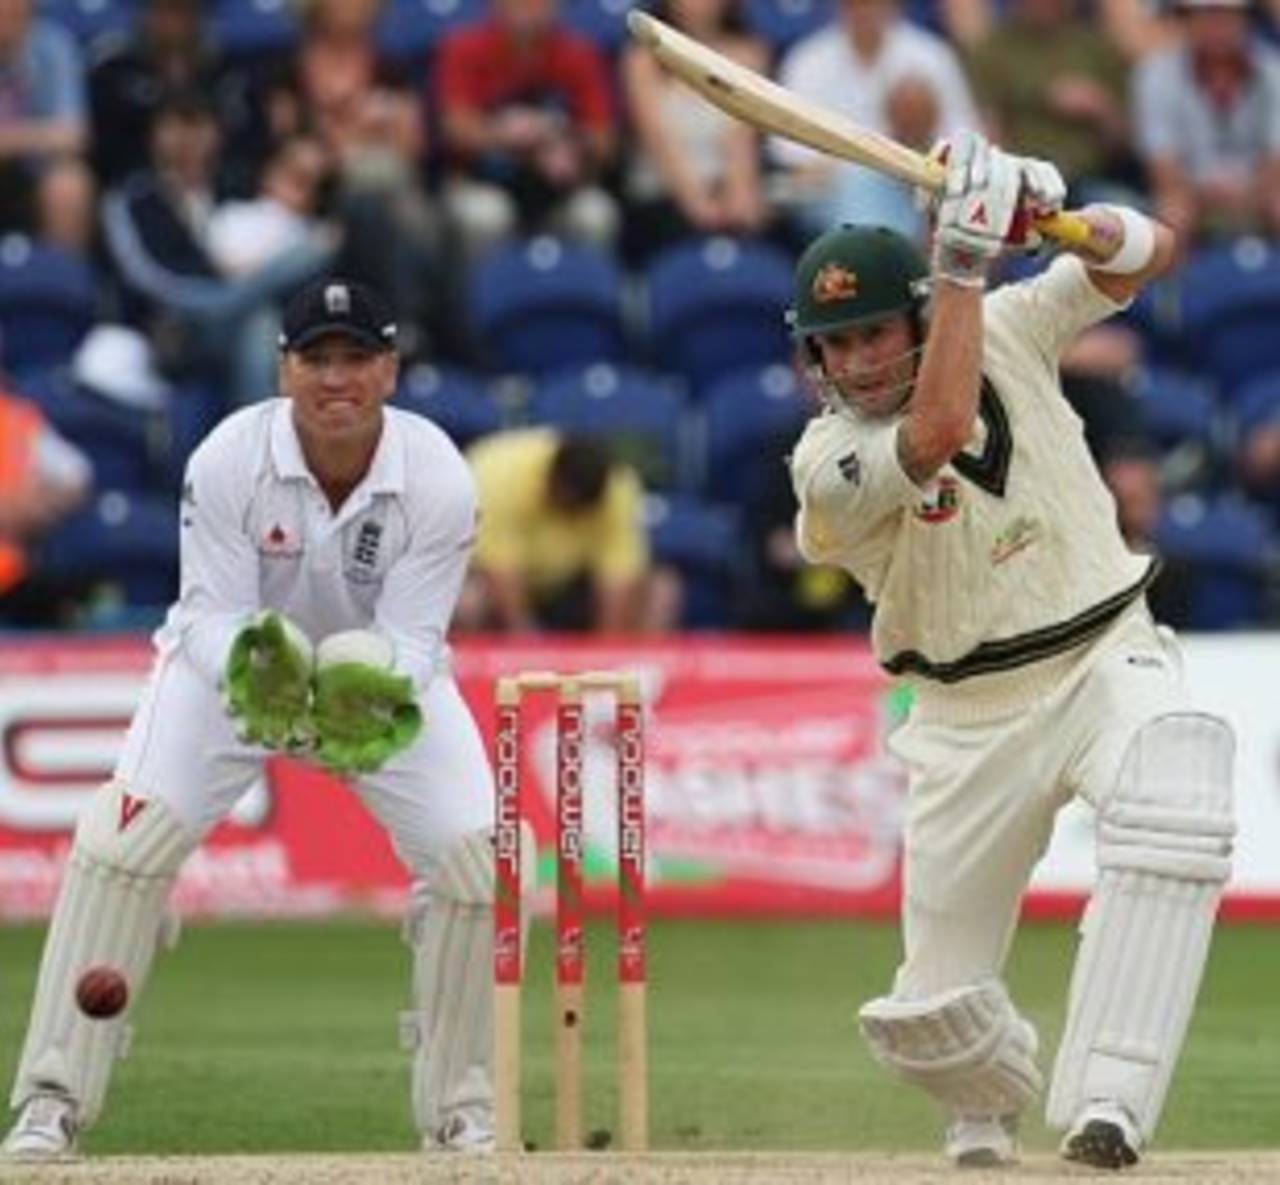
Michael Clarke has turned it on over the last three years, averaging more than 60 in his last 28 Tests • Getty Images
By scoring a century in his 50th Test, Michael Clarke achieved a feat that only three Australian batsmen had previously - Bob Simpson, Bill Lawry and Mark Taylor. More than that, though, what will please Clarke is the manner in which he has taken up responsibility and delivered for Australia over the last three years.
Fittingly, Clarke's unbeaten 103 at Edgbaston also lifted his career average to more than 50 for the first time since his seventh Test, way back in December 2004. After a dream debut against India earlier that year, Clarke's batting went into a bit of a freefall for the next couple of years, as his average slumped from 60 to 36 in a mere 16 matches. (Click here for his cumulative career average.)
Since then, though, the graph has been looking very good again. It started with the Ashes in Australia in 2006-07, when Clarke scored two hundreds and averaged almost 78. He averaged more than 50 on the tour to the West Indies, and more than 70 in the home series against New Zealand and South Africa. (Click here for his series-wise performances.) He wasn't quite as impressive on tours to India and South Africa, but his overall average since November 2006 is still more than 60. Among batsmen who've played at least 15 Tests during this period, only three have a better average.
| Period | Runs | Average | 100s/ 50s |
| First 22 Tests | 1123 | 36.22 | 2/ 4 |
| Last 28 Tests | 2433 | 60.82 | 10/ 10 |
| Career (50 Tests) | 3556 | 50.08 | 12/ 14 |
Over these two years, Clarke has made the No. 5 position his own. He has played two-thirds of his Test innings in that position, and averages more than 55 there. Already he is the third-highest run-scorer at No. 5 for Australia: only Steve Waugh and Allan Border have managed more. Given his amazing run and Michael Hussey's iffy form, though, there might be a case for Clarke to move up a place in the batting order. Among Australians who've scored at least 750 runs at No. 5, only Hussey and Steve Waugh have a higher average than Clarke's 55.20.
| Batsman | Tests | Runs | Average | 100s/ 50s |
| Michael Hussey | 12 | 936 | 78.00 | 3/ 4 |
| Steve Waugh | 104 | 6754 | 56.28 | 24/ 29 |
| Michael Clarke | 35 | 2650 | 55.20 | 9/ 12 |
| Allan Border | 58 | 3071 | 52.05 | 9/ 15 |
| Doug Walters | 32 | 2134 | 47.42 | 5/ 14 |
| Ross Edwards | 15 | 839 | 46.61 | 1/ 8 |
| Stan McCabe | 22 | 1114 | 44.56 | 1/ 8 |
| Keith Miller | 38 | 1973 | 41.97 | 5/ 9 |
| Kim Hughes | 25 | 1360 | 41.21 | 3/ 6 |
The other impressive aspect about Clarke's batting is his adeptness against both pace and spin. He has handled the pace and swing of Anderson, Flintoff and Co much better than most of his mates during this series, and has been equally assured - demonstrating excellent footwork - against the spin of Graeme Swann. Overall, his average against pace is quite similar to that against spin, as is his scoring-rate.
| Bowling type | Runs | Dismissals | Average | Runs per over |
| Pace | 2146 | 42 | 51.09 | 3.23 |
| Spin | 1410 | 26 | 54.23 | 3.12 |
Clarke's stats against each bowler present some interesting findings, none more so than the fact that while Andrew Flintoff has terrorised most of the other Australian batsmen, he hasn't found a way past Clarke: in 375 balls, Clarke hasn't fallen to Flintoff even once. In fact, Clarke has done extremely well against a couple of other hit-the-deck bowlers as well - he hasn't been dismissed by South Africa's Makhaya Ntini and Morne Morkel in the 360 deliveries that they've bowled to him.
However, the going hasn't been quite as good against two other tall fast bowlers - Steve Harmison and Ishant Sharma have been among the most successful against Clarke. Harmison dismissed him a couple of times in each of the last two Ashes series, and also nailed him once in the Super Test, while Ishant got his man twice on India's tour to Australia in 2007-08 and three times when the Australians toured India last year. Clarke has fallen to Sharma five times, at a rate of once every five overs.
Most of the swing bowlers have done pretty well against him too - Simon Jones got him three times in 2005, while Dale Steyn has got him five times at an average of less than 25. Among the bowlers in England's current line-up, James Anderson would fancy his chances the most, having dismissed Clarke three times in 130 deliveries, while Matthew Hoggard hasn't done badly against him either.
Clarke's stats against most of the top spinners are pretty impressive - Muttiah Muralitharan has toiled almost 30 overs without dismissing him once, while Anil Kumble has had mixed results, getting him six times but at a relatively high average. England's two left-arm spinners have had scant success against Clarke, but Paul Harris and Daniel Vettori have fared better. India's Amit Mishra, though, boasts the best record among spinners, dismissing him three times at an average of 17.33.
| Bowler | Runs | Balls | Dismissals | Average | Strike rate |
| Andrew Flintoff | 195 | 375 | 0 | - | 3.12 |
| Makhaya Ntini | 101 | 204 | 0 | - | 2.97 |
| Muttiah Muralitharan | 98 | 178 | 0 | - | 3.30 |
| Morne Morkel | 82 | 156 | 0 | - | 3.15 |
| Monty Panesar | 89 | 136 | 0 | - | 3.92 |
| Ashley Giles | 149 | 222 | 1 | 149.00 | 4.02 |
| Harbhajan Singh | 167 | 372 | 2 | 83.50 | 2.69 |
| Zaheer Khan | 138 | 263 | 3 | 46.00 | 3.14 |
| Anil Kumble | 276 | 469 | 6 | 46.00 | 3.53 |
| Matthew Hoggard | 158 | 243 | 4 | 39.50 | 3.90 |
| Daniel Vettori | 95 | 201 | 3 | 31.67 | 2.83 |
| Paul Harris | 127 | 324 | 4 | 31.75 | 2.35 |
| James Anderson | 78 | 130 | 3 | 26.00 | 3.60 |
| Dale Steyn | 122 | 189 | 5 | 24.40 | 3.87 |
| Steve Harmison | 116 | 235 | 6 | 19.33 | 2.96 |
| Amit Mishra | 52 | 121 | 3 | 17.33 | 2.57 |
| Ishant Sharma | 81 | 155 | 5 | 16.20 | 3.13 |
| Simon Jones | 47 | 68 | 3 | 15.67 | 4.14 |
So how does Clarke compare with other top Australian batsmen at the same stage in their careers? Leave aside the Don, and Clarke's numbers stack up pretty well against the others. Ricky Ponting and Steve Waugh had considerably poorer stats after 50 Tests, though both improved dramatically thereafter.
| Batsman | Runs | Average | 100s/ 50s |
| Don Bradman | 6790 | 99.85 | 28/ 13 |
| Ricky Ponting | 3081 | 44.65 | 9/ 14 |
| Steve Waugh | 2387 | 36.16 | 4/ 14 |
| Allan Border | 3492 | 46.56 | 9/ 21 |
| Matthew Hayden | 4488 | 58.28 | 17/ 14 |
| Mark Waugh | 3222 | 42.39 | 8/ 20 |
| Justin Langer | 3487 | 44.70 | 12/ 15 |
| Mark Taylor | 4044 | 48.72 | 12/ 22 |
| Greg Chappell | 4058 | 53.39 | 14/ 20 |
| Neil Harvey | 4311 | 53.88 | 16/ 16 |
| Doug Walters | 3869 | 50.90 | 12/ 23 |
| Adam Gilchrist | 3159 | 57.43 | 9/ 16 |
| Bill Lawry | 4130 | 49.75 | 12/ 20 |
| Bob Simpson | 3995 | 48.71 | 7/ 24 |
| Damien Martyn | 3402 | 47.91 | 9/ 20 |
| Dean Jones | 3422 | 45.62 | 10/ 13 |
Clarke's career stats are still skewed in favour of home games - he averages 58.70 in Australia and 43.40 everywhere else. Even during this golden run, his two ordinary series have been in India and South Africa. In the current Ashes, though, he averages 88, with two centuries in three matches. Clearly, he is moving in the right direction.
S Rajesh is stats editor of Cricinfo