Ntini and his first-Test blues
The difference between Makhaya Ntini's bowling average in first and second Tests of series is more than ten runs per wicket
S Rajesh
18-Jul-2008
| ||
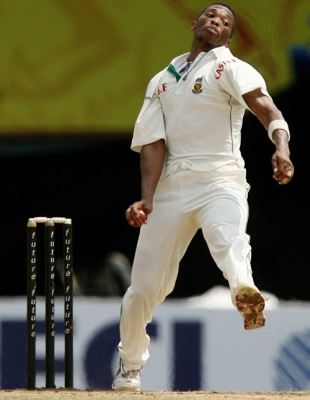
"Makhaya has tended in the past to make slow starts to series." These were the words of Vincent Barnes, South Africa's assistant coach, a couple of days before the start of the second Test against England at Headingley. Barnes was referring to Makhaya Ntini, the most experienced bowler in the current South African squad, and his toothless performance in the first Test at Lord's, where he bowled 29 innocuous overs and leaked 130 runs without taking a wicket. It was the most runs he had ever conceded in a Test innings without taking a wicket, and as a statement of intent it was as weak as it could get from the team's leading bowler.
The good news, though, is that things are likely to improve in the next Test - if past records are anything to go by, that is. Ntini has had more than one instance of starting a series sluggishly and then cranking it up in the second Test, which is probably what prompted Barnes to suggest, "We are confident he will get better." The last two times Ntini finished wicketless in the first Test, he hit back rather strongly: on the tour of Sri Lanka in 2006, he returned figures of none for 97 in the first Test, as Sri Lanka piled 756 for 5 and eventually won by an innings. After a three-day break, he came back with a match analysis of 5 for 97 in the second. The contrast was even more stark on the tour to the West Indies in 2005: in Georgetown, Ntini went wicketless and conceded 98 from 23 overs; in the second Test, in Port-of-Spain, he walked away with match figures of 13 for 132, and the Man-of-the-Match award. On both occasions he took the top three opposition wickets in their first innings, a rather unequivocal statement of intent.
Over his ten-year Test career, Ntini has done this two-card trick fairly often, which is why his second-Test average of 22.96 is more than ten below his first-Test average of 33.52.
The table below looks at how that difference stacks up against other bowlers in Test history. Among the bowlers who've sent down at least 2000 deliveries apiece in first and second Tests of series in their careers - and there are 125 who make the cut - Ntini's difference puts him in 11th place. At the top of the list is India's allrounder Ravi Shastri, who conceded nearly 60 runs per wicket in first Tests, but picked them up at 31 apiece in second Tests, a difference of more than 28 runs per wicket. Ntini is the only South African in the top 12, which also includes three Pakistan representatives - their current coach, a former captain and a former allrounder.
| Bowler | 1st Test - balls | Wkts | Average | 2nd Test - balls | Wkts | Average | Diff in Ave |
|---|---|---|---|---|---|---|---|
| Ravi Shastri | 4044 | 28 | 59.39 | 4234 | 50 | 31.20 | 28.19 |
| Bryan Strang | 2787 | 23 | 54.91 | 2148 | 27 | 29.40 | 25.51 |
| John Reid | 2324 | 17 | 49.52 | 2065 | 26 | 29.30 | 20.22 |
| Abdul Razzaq | 3200 | 36 | 48.44 | 2724 | 50 | 28.26 | 20.18 |
| Geoff Lawson | 2728 | 32 | 42.40 | 2640 | 50 | 26.50 | 15.90 |
| Ray Price | 2247 | 27 | 44.59 | 2840 | 42 | 29.73 | 14.86 |
| Intikhab Alam | 3488 | 31 | 50.58 | 2968 | 36 | 36.63 | 13.95 |
| Mervyn Dillon | 2486 | 25 | 47.24 | 2492 | 36 | 33.88 | 13.36 |
| Kumar Dharmasena | 2908 | 22 | 52.22 | 2402 | 27 | 39.40 | 12.82 |
| David Allen | 3133 | 28 | 38.35 | 2328 | 28 | 26.89 | 11.46 |
| Makhaya Ntini | 6485 | 109 | 33.52 | 6580 | 145 | 22.96 | 10.56 |
| Ewen Chatfield | 3831 | 39 | 38.58 | 3205 | 43 | 28.04 | 10.54 |
At the other end of the spectrum are the bowlers who made strong starts to series, but then failed to live up to expectations in the next game. On top of that pile is that enigma from Pakistan, Mohammad Sami. In first Tests he averages 42.56, which is hardly impressive, but even that seems like a mighty good effort when compared to his ridiculous second-Test average of 76.94 - in 11 such Tests he has only taken 17 wickets at a strike-rate of 136 deliveries per dismissal. He showed traces of what was to come in his first series, taking 8 for 106 in his first Test, and following it up with none for 139 in his second. Unfortunately for him, the first-Test successes soon became a thing of the past too.
Phil Tufnell and Mohammad Rafique, both left-arm spinners, have had similar troubles. Tufnell's average in the first or only Tests of series is an impressive 26.15, but it balloons to more than 47 in second Tests, with the strike-rate going up to 123 balls per wicket. Australia's Terry Alderman has similar stats - his astonishing first-Test average of 20.93 almost doubles to 40.38 in the second. (Click here for his career summary and then scroll to the bottom of the page for his Test-wise average.)
| Bowler | 1st Test - balls | Wkts | Average | 2nd Test - balls | Wkts | Average | Diff in Ave |
|---|---|---|---|---|---|---|---|
| Mohammad Sami | 3039 | 44 | 42.56 | 2322 | 17 | 76.94 | -34.38 |
| Mohammad Rafique | 4534 | 61 | 32.90 | 3840 | 32 | 58.78 | -25.88 |
| Phil Tufnell | 2624 | 40 | 26.15 | 2955 | 24 | 47.58 | -21.43 |
| Sarfraz Nawaz | 4380 | 64 | 25.57 | 3121 | 32 | 45.37 | -19.80 |
| Terry Alderman | 3269 | 65 | 20.93 | 2264 | 26 | 40.38 | -19.45 |
| Ashley Mallett | 2359 | 31 | 28.77 | 2005 | 17 | 26.23 | -17.46 |
| Michael Kasprowicz | 2595 | 44 | 27.43 | 2334 | 30 | 43.96 | -16.53 |
| Tony Lock | 2332 | 37 | 18.08 | 2066 | 23 | 34.04 | -15.96 |
| Stuart MacGill | 2670 | 66 | 21.71 | 2823 | 45 | 36.40 | -14.69 |
| Max Walker | 2210 | 37 | 22.13 | 2978 | 34 | 35.47 | -13.34 |
| Danny Morrison | 4347 | 80 | 29.01 | 3186 | 43 | 42.09 | -13.08 |
| Mashrafe Mortaza | 2573 | 41 | 34.90 | 2298 | 25 | 47.68 | -12.78 |
Bunched between those two extremes are the players who were consistently good - or bad - through first and second Tests. Shane Warne heads this table - the difference between his first and second Test averages is, quite remarkably, only 0.04. (His problem was third Tests, in which his average went up to 32.22.)
This list has an impressive crop of fast bowlers and spinners - Brett Lee, Shaun Pollock, Shoaib Akhtar, Ray Lindwall and Malcolm Marshall all have an average difference of less than one, as do Daniel Vettori and Bishan Bedi.
| Bowler | 1st Test - balls | Wkts | Average | 2nd Test - balls | Wkts | Average | Diff in Ave |
|---|---|---|---|---|---|---|---|
| Shane Warne | 12,043 | 233 | 22.77 | 12,068 | 226 | 22.73 | 0.04 |
| Shoaib Akhtar | 3580 | 84 | 24.11 | 3149 | 74 | 24.17 | -0.06 |
| Andrew Caddick | 3076 | 54 | 29.62 | 3612 | 59 | 29.54 | 0.08 |
| John Emburey | 3237 | 38 | 33.50 | 2501 | 27 | 33.59 | -0.09 |
| Daniel Vettori | 8218 | 106 | 33.61 | 7845 | 107 | 33.76 | -0.15 |
| Shaun Pollock | 7753 | 140 | 22.15 | 7706 | 139 | 22.32 | -0.17 |
| Brett Lee | 3756 | 79 | 26.86 | 4261 | 88 | 27.12 | -0.26 |
| Waqar Younis | 6758 | 150 | 24.47 | 5111 | 112 | 24.75 | -0.28 |
| Ray Lindwall | 2537 | 43 | 20.53 | 2726 | 51 | 20.15 | 0.38 |
| Bishan Bedi | 4887 | 53 | 28.86 | 6013 | 78 | 28.37 | 0.49 |
| Guy Whittall | 2092 | 24 | 40.75 | 2019 | 21 | 40.14 | 0.61 |
| Abdul Qadir | 4973 | 73 | 30.56 | 5079 | 77 | 29.85 | 0.71 |
| Malcolm Marshall | 3419 | 69 | 21.52 | 4117 | 94 | 20.58 | 0.94 |
S Rajesh is stats editor of Cricinfo. For the stats he was helped by Travis Basevi, the man who built Statsguru.