Dots, boundaries, and a WT20 for spinners
A look at the two finalists and their run-gathering methods, and the huge role that spinners have played in the tournament so far
S Rajesh
Apr 1, 2016, 4:30 AM
Spinners have been dominant in this edition of the World T20, just as they had been in the previous two as well • ESPNcricinfo Ltd
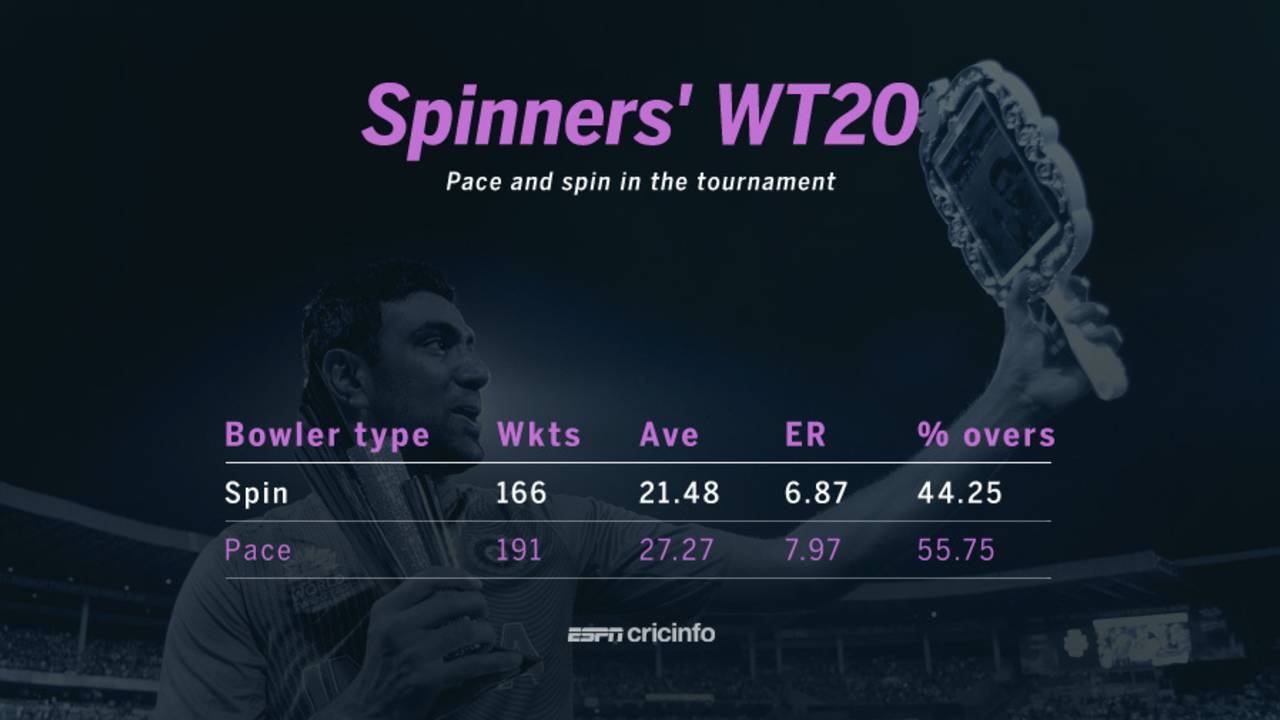
As expected, the 2016 World T20 has been dominated by spinners. With two matches to go in the tournament, spinners have collectively taken 166 wickets at an average of 21.48 and an economy rate of 6.87; they have bowled about 44% of the total overs, and taken 46% of the total wickets which have fallen to bowlers. Seamers, on the other hand, have gone for 7.97 runs to the over, while each of their wickets have cost 27.27 runs. Spinners have thus been 14% better than their seam counterparts in terms of economy rate, and 21% better in terms of averages. The pitches in most Indian venues have been slow and sluggish, encouraging the quick bowlers to take pace off the ball, making lack of pace, and turn, the biggest weapons for the bowlers.
All of those above numbers aren't much of a surprise, but what is more surprising is the extent to which these are similar to the stats from the two previous World T20s. The 2014 edition was held in Bangladesh, and the 2012 in Sri Lanka, and it's clear that the subcontinent conditions in each of these countries have resulted in major contributions by spinners each time. In fact, the economy rates for spinners in the last three World T20s are exactly the same - 6.87. The average has fallen even further in the 2016 edition, which is an indication of the nature of the pitches here.
And while these numbers include all matches in the tournament, the stats aren't very different when considering only the Super 10 games: in these matches, spinners have gone at 6.83 per over and averaged 21.95 per wicket, compared to an economy rate of 8.13 and an average of 27.79 for the quicker bowlers.
| Edition | Mat | Overs | % overs | Wkts | Ave | Econ | SR |
| 2016 | 33 | 518.2 | 44.25 | 166 | 21.48 | 6.87 | 18.7 |
| 2014 | 35 | 563.5 | 43.87 | 169 | 22.94 | 6.87 | 20.0 |
| 2012 | 27 | 446.0 | 45.73 | 126 | 24.34 | 6.87 | 21.2 |
| 2010 | 27 | 418.5 | 42.56 | 116 | 25.96 | 7.19 | 21.6 |
| 2009 | 27 | 383.4 | 38.36 | 125 | 20.32 | 6.62 | 18.4 |
| 2007 | 27 | 237.2 | 24.05 | 79 | 23.55 | 7.84 | 18.0 |
| Players | Mat | Overs | % overs | Wkts | Ave | Econ | SR |
| 2016 | 33 | 653.0 | 55.75 | 191 | 27.27 | 7.97 | 20.5 |
| 2014 | 35 | 720.5 | 56.1 | 217 | 25.66 | 7.72 | 19.9 |
| 2012 | 27 | 526.2 | 53.96 | 166 | 25.07 | 7.90 | 19.0 |
| 2010 | 27 | 564.4 | 57.4 | 202 | 21.04 | 7.52 | 16.7 |
| 2009 | 27 | 593.0 | 59.34 | 184 | 25.67 | 7.96 | 19.3 |
| 2008 | 27 | 737.0 | 74.74 | 227 | 25.26 | 7.78 | 19.4 |
The Powerplay numbers in this tournament further illustrate how well spinners have done in this tournament, and how much of a struggle it has been for the quicks. Spinners have bowled almost 30% of the Powerplay overs, and have gone at only 6.67 per over. Seamers, on the other hand, have gone at almost seven-and-a-half an over and conceded more than 34 runs per wicket, compared to the spin average of 23.15. In the Super 10s, the numbers change only marginally for spinners: the average stays at 23.15, while the economy rate drops to 6.61; the seamers have fared worse in the Super 10s, averaging 36.05 runs per wicket, and 7.72 per over.
The spinners did even better in terms of economy rate and average in the 2012 edition in Sri Lanka, but overall a pattern has emerged in the last three World T20s, each of which has been held in the subcontinent: slow bowlers have played a bigger role in each of these three tournaments than in previous editions, and have been a force even when bowling with the new ball with field restrictions at the start of an innings. With the next World T20 to be hosted in Australia, though, fast bowlers will be hoping that the comparison numbers aren't so skewed the next time around.
| Edition | Wkts | Ave | ER | % balls | BpB* |
| 2016 | 32 | 23.15 | 6.67 | 29.37 | 5.95 |
| 2014 | 33 | 25.87 | 6.77 | 30.12 | 5.64 |
| 2012 | 23 | 19.69 | 5.96 | 23.90 | 8.14 |
| 2010 | 16 | 28.00 | 6.30 | 22.14 | 8.88 |
| 2009 | 7 | 31.00 | 7.23 | 9.29 | 7.50 |
| 2007 | 0 | - | 13.00 | 1.28 | 2.67 |
| Edition | Wkts | Ave | ER | % balls | BpB* |
| 2016 | 58 | 34.36 | 7.46 | 70.63 | 5.13 |
| 2014 | 70 | 28.68 | 6.86 | 69.88 | 5.66 |
| 2012 | 58 | 28.67 | 6.87 | 76.10 | 6.15 |
| 2010 | 76 | 21.84 | 6.64 | 77.86 | 6.72 |
| 2009 | 71 | 31.61 | 7.66 | 90.71 | 5.11 |
| 2007 | 82 | 26.92 | 7.16 | 98.72 | 5.75 |
All stats above exclude the semi-final between India and West Indies in Mumbai.
Of boundaries and dot balls
The World T20 final will be played between the team with the highest dot-ball percentage in the tournament, and the team with the second-lowest dot percentage; it will also be played between the two teams with the highest percentage of their runs scored in boundaries.
Through this tournament, West Indies' dot-ball percentage has been 45.44. In the Super 10 stage, the team with the next-highest dot percentage was Bangladesh, at 44.05. For England, South Africa and Pakistan, the dot percentage was lower than 35. Conventional wisdom says that in this format dot balls are a huge liability for the batting team, but that clearly doesn't hold for West Indies. Two of the three with sub-35 dot percentages didn't even make it to the semi-finals, while West Indies have powered their way to the final.
That's because they have compensated for their high dot-ball factor with an equally high boundary-scoring ability. Against India, they scored 146 runs in boundaries and only 44 by running between the wickets, while India scored only 92 in boundaries and 95 in singles, twos and threes. Clearly, West Indies have so many power-hitters in their line-up that a few extra dots matter little to them; they know they can make up for that by clearing the boundary.
Their opponent in the final, though, will be a team that has so far shown the ability to do both, keep the dots to a minimum but also, at the same time, score plenty of runs in boundaries. It has helped, of course, that they have played two of their matches at the batting-friendly Wankhede Stadium, but even so, in Joe Root, Jos Buttler, Eoin Morgan and Ben Stokes, England have a middle order that mixes the big hits with sharp running between the wickets. If the Eden Gardens surface turns out to be reasonably batting friendly, the final could well be a celebration of runs and boundaries between the two most power-packed batting teams of this tournament.
| Batting Team | Inngs | 4s | 6s | Run rate | Ave | Dot % | Boundary % |
| West Indies | 5 | 61 | 36 | 7.27 | 29.33 | 45.44 | 65.34 |
| Bangladesh | 4 | 47 | 14 | 6.44 | 17.42 | 44.05 | 55.74 |
| Sri Lanka | 4 | 42 | 22 | 6.60 | 18.60 | 43.76 | 57.58 |
| Afghanistan | 4 | 41 | 25 | 6.90 | 17.80 | 43.54 | 56.88 |
| New Zealand | 5 | 64 | 21 | 7.03 | 21.30 | 40.17 | 54.34 |
| India | 5 | 58 | 18 | 7.12 | 24.77 | 36.41 | 50.82 |
| Australia | 4 | 59 | 19 | 7.71 | 24.28 | 35.17 | 57.66 |
| Pakistan | 4 | 63 | 18 | 8.01 | 27.30 | 34.68 | 57.32 |
| England | 5 | 78 | 34 | 8.45 | 32.80 | 33.85 | 62.93 |
| South Africa | 4 | 60 | 28 | 8.49 | 41.25 | 33.48 | 61.82 |
S Rajesh is stats editor of ESPNcricinfo. Follow him on Twitter