Ishant and Prasad turn lethal, and the tail wags
Ishant Sharma and Dhammika Prasad seem to have both turned a corner in the last 18 months, while tail became top in the recent Sri Lanka-India series
S Rajesh
Sep 4, 2015, 2:24 AM
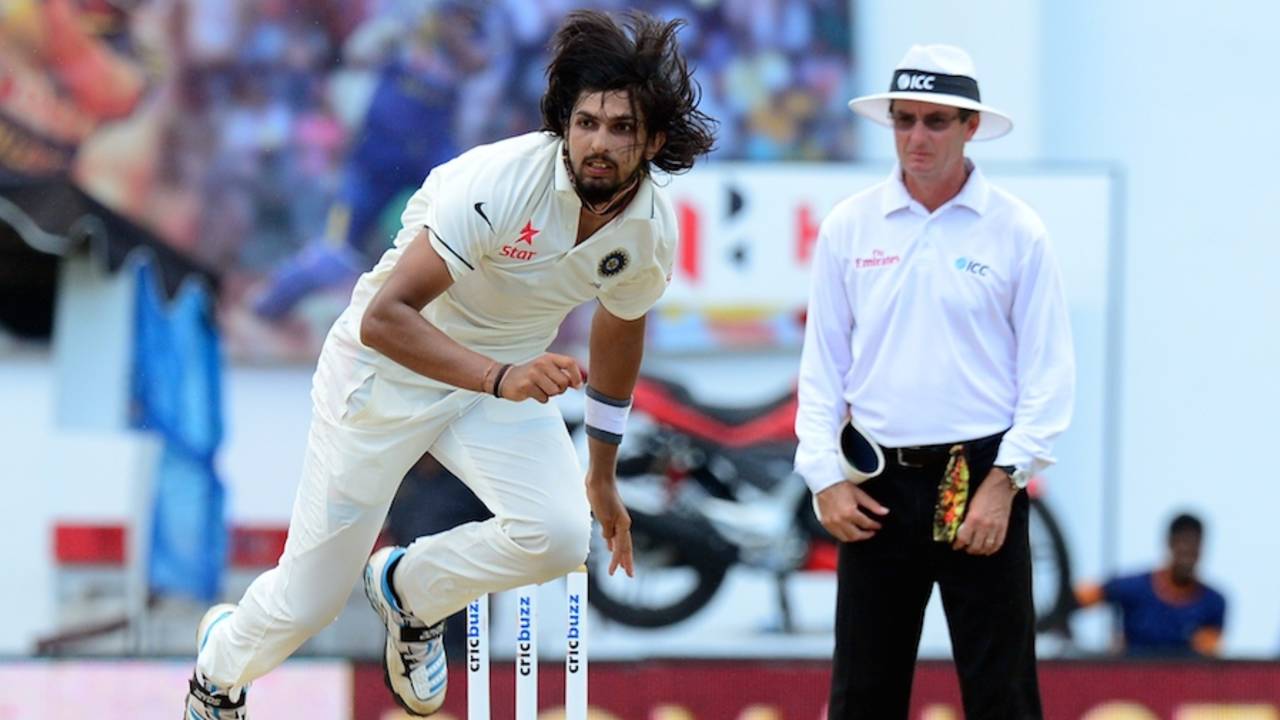
Ishant Sharma has more five-fors in his last 21 Test innings than he did in his previous 93 • AFP
When a 19-year-old Ishant Sharma bowled those outstanding spells on the 2007-08 tour to Australia, having played just two Tests before that series, great things were expected from him. He had pace, his height allowed him to extract discomforting bounce, and he wasn't afraid to test his skills against the best opposition batsmen. On that tour, he took only six wickets at an average of nearly 60, but numbers weren't important then; it was the sheer potential, which gave rise to the expectation that great things would follow.
The next six years were largely frustrating for those who bet on Ishant, and one suspects, for Ishant himself. He did well in the home series against Australia in 2008, but in 38 Tests between 2009 and 2013, he managed only 105 wickets at 41.84 - poor returns by any standards, and terrible ones for a new-ball bowler expected to lead the team's attack.
The expectations were quite high for Dhammika Prasad too when he took two wickets off successive balls on his ODI debut, against Bangladesh in 2006. On his Test debut against India a couple of years later - and a year after Ishant played his first Test - he returned match figures of 5 for 142, including the wicket of Virender Sehwag, India's best batsman of that series, in both innings. There were many expectations from him too, but till the end of 2013 he too was a huge disappointment, playing just 12 Tests and taking 22 wickets in those at an average of 59.
Since 2014, though, both bowlers have got a second wind. In 12 Tests in the last 18 months, Ishant has taken 51 wickets at 29.76. In 21 innings during this period he has four five-fors, which is more than the number of five-fors he got in 93 innings before that (three). His strike rate has improved from 73.5 (between 2009 and 2013), to 52.1.
| Period | Tests | Wickets | Average | SR | 5WI |
| Till Dec 2008 | 15 | 44 | 31.59 | 60.6 | 1 |
| Jan 2009 to Dec 2013 | 38 | 105 | 41.84 | 73.5 | 2 |
| Jan 2014 onwards | 12 | 51 | 29.76 | 52.1 | 4 |
| Career | 65 | 200 | 36.51 | 65.2 | 7 |
Similarly, Prasad's stats are unrecognisable from his earlier numbers: in his 11 most recent Tests, he has taken 44 wickets - that's twice as many as in his first 12 - at an average of 28.68, which is less than half the earlier average. During this period, he has played five series (including one Test in England in 2014), and averaged less than 30 in three of them. In six Tests in the home season, he took 29 wickets at 25.27; only once has a Sri Lankan seamer taken more wickets in a home season - Chaminda Vaas took 40 from seven Tests in 2001-02. (Vaas also takes up positions three to eight in that table.)
| Period | Tests | Wickets | Average | SR | 5WI |
| Till Dec 2013 | 12 | 22 | 59.00 | 82.7 | 0 |
| Jan 2014 onwards | 11 | 44 | 28.68 | 50.6 | 1 |
| Career | 23 | 66 | 38.78 | 61.3 | 1 |
In the Sri Lanka-India series, both Prasad and Ishant took more than 12 wickets, making it the first instance since 1985 that a seamer has taken more than 12 wickets in a Test series between these two teams. (In 1985, though, three bowlers finished with more than 12 - Rumesh Ratnayake, Saliya Ahangama and Chetan Sharma.)
Both Ishant and Prasad are among ten fast bowlers who have taken 40 or more wickets in Tests since the beginning of 2014. Not many would have given them a chance to be on such a shortlist before 2014, but both have been remarkably lethal and consistent over the last 18 months. The challenge for them will be to continue to perform as consistently over the next several series, and take over as the clear leaders of their respective attacks. (For Ishant, the challenge is also to stay aggressive with the ball without the verbal send-offs and over-the-top antics.)
| Player | Tests | Wickets | Average | SR | 5WI |
| Dale Steyn | 11 | 52 | 19.69 | 38.3 | 3 |
| Josh Hazlewood | 9 | 40 | 21.75 | 44.1 | 2 |
| James Anderson | 16 | 73 | 23.63 | 50.5 | 3 |
| Mitchell Johnson | 16 | 70 | 25.22 | 46.0 | 2 |
| Stuart Broad | 18 | 74 | 25.54 | 51.4 | 3 |
| Trent Boult | 12 | 51 | 27.94 | 59.2 | 1 |
| Dhammika Prasad | 11 | 44 | 28.68 | 50.6 | 1 |
| Jerome Taylor | 12 | 40 | 28.97 | 57.2 | 1 |
| Ishant Sharma | 12 | 51 | 29.76 | 52.1 | 4 |
| Tim Southee | 12 | 43 | 32.06 | 67.1 | 0 |
Topsy-turvy partnerships in Sri Lanka
The average opening partnership in the just-concluded Sri Lanka-India Test series was 5.91; the average for the tenth wicket was 7.72. That's only the 12th time in Test history, in series with at least ten partnerships for each wicket, that the last-wicket average has exceeded the first. Five of those instances happened more than 100 years ago, while there were only three more such cases between 1907 and 2008. However, since 2009 there have been four such instances, with India being involved in two of them. Last year in their five-Test series in England, the average partnership for the tenth wicket was 38.38, while the opening stand was only worth 25.05. England's average for the tenth wicket was a whopping 66.75, including the 198-run stand between Joe Root and James Anderson at Trent Bridge; India had a tenth-wicket century stand in that Test as well as Mohammed Shami and Bhuvneshwar Kumar added 111.
The average opening partnership in the just-concluded Sri Lanka-India Test series was 5.91; the average for the tenth wicket was 7.72. That's only the 12th time in Test history, in series with at least ten partnerships for each wicket, that the last-wicket average has exceeded the first. Five of those instances happened more than 100 years ago, while there were only three more such cases between 1907 and 2008. However, since 2009 there have been four such instances, with India being involved in two of them. Last year in their five-Test series in England, the average partnership for the tenth wicket was 38.38, while the opening stand was only worth 25.05. England's average for the tenth wicket was a whopping 66.75, including the 198-run stand between Joe Root and James Anderson at Trent Bridge; India had a tenth-wicket century stand in that Test as well as Mohammed Shami and Bhuvneshwar Kumar added 111.
The difference of 13.33 between the last-wicket and first-wicket average stand is easily the highest for a series (with a ten-innings cut-off). When the difference is taken as a percentage of the average opening stand, though, the highest is the 1888 Ashes contest, when the difference of 8.00 was almost as much as the opening average of 8.70. In the Sri Lanka-India series, the difference of 1.81 was about 31% of the opening partnership of 5.92.
| series | 10th wkt ave | 1st wkt ave | Difference |
| India in Sri Lanka, 2015 | 7.73 | 5.92 | 1.81 |
| India in England, 2014 | 38.38 | 25.06 | 13.33 |
| Pakistan in England, 2010 | 20.00 | 15.47 | 4.53 |
| England in South Africa, 2009-10 | 22.25 | 22.21 | 0.04 |
| West Indies in Pakistan, 1980-81 | 21.11 | 18.38 | 2.73 |
| West Indies in England, 1966 | 23.31 | 19.06 | 4.25 |
| India in West Indies, 1961-62 | 25.93 | 23.59 | 2.34 |
| England in South Africa, 1905-06 | 22.93 | 14.16 | 8.78 |
| England in South Africa, 1895-96 | 11.20 | 6.10 | 5.10 |
| England in Australia, 1894-95 | 26.75 | 21.26 | 5.49 |
| Australia in England, 1888 | 16.70 | 8.70 | 8.00 |
| England in Australia, 1884-85 | 25.60 | 21.67 | 3.93 |
Also, the average partnership for the top five wickets in the Sri Lanka-India series was 29.90, while that for the last five wickets was 25.10. The difference of 4.80 is among the lowest in a series of three or more Tests since 2000. The two lowest ones were instances when the average partnership for the last five was more than the top five - both those were series between Australia and New Zealand, held within a couple of years of each other.
| Series | Top 5 ave | Bottom 5 ave | Difference |
| NZ in Aust, 2001-02 | 44.06 | 49.39 | -5.33 |
| Aust in NZ, 1999-2000 | 26.03 | 28.54 | -2.51 |
| Pak in Eng, 2010 | 23.65 | 23.29 | 0.36 |
| NZ in SA, 2006 | 31.72 | 31.25 | 0.47 |
| Pak in Ind, 2007-08 | 45.67 | 43.42 | 2.24 |
| SL in Ind, 2005-06 | 31.16 | 27.98 | 3.19 |
| Ind in Eng, 2014 | 34.57 | 30.79 | 3.78 |
| WI in Aust, 2000-01 | 29.99 | 25.33 | 4.66 |
| Pak in NZ, 2009-10 | 31.80 | 27.04 | 4.76 |
| Ind in SL, 2015 | 29.90 | 25.10 | 4.80 |
With inputs from Shiva Jayaraman.
S Rajesh is stats editor of ESPNcricinfo. Follow him on Twitter