Morgan leads England's ODI resurgence
England's form in one-day internationals has improved significantly since their Irish import joined them
S Rajesh
25-Jun-2010
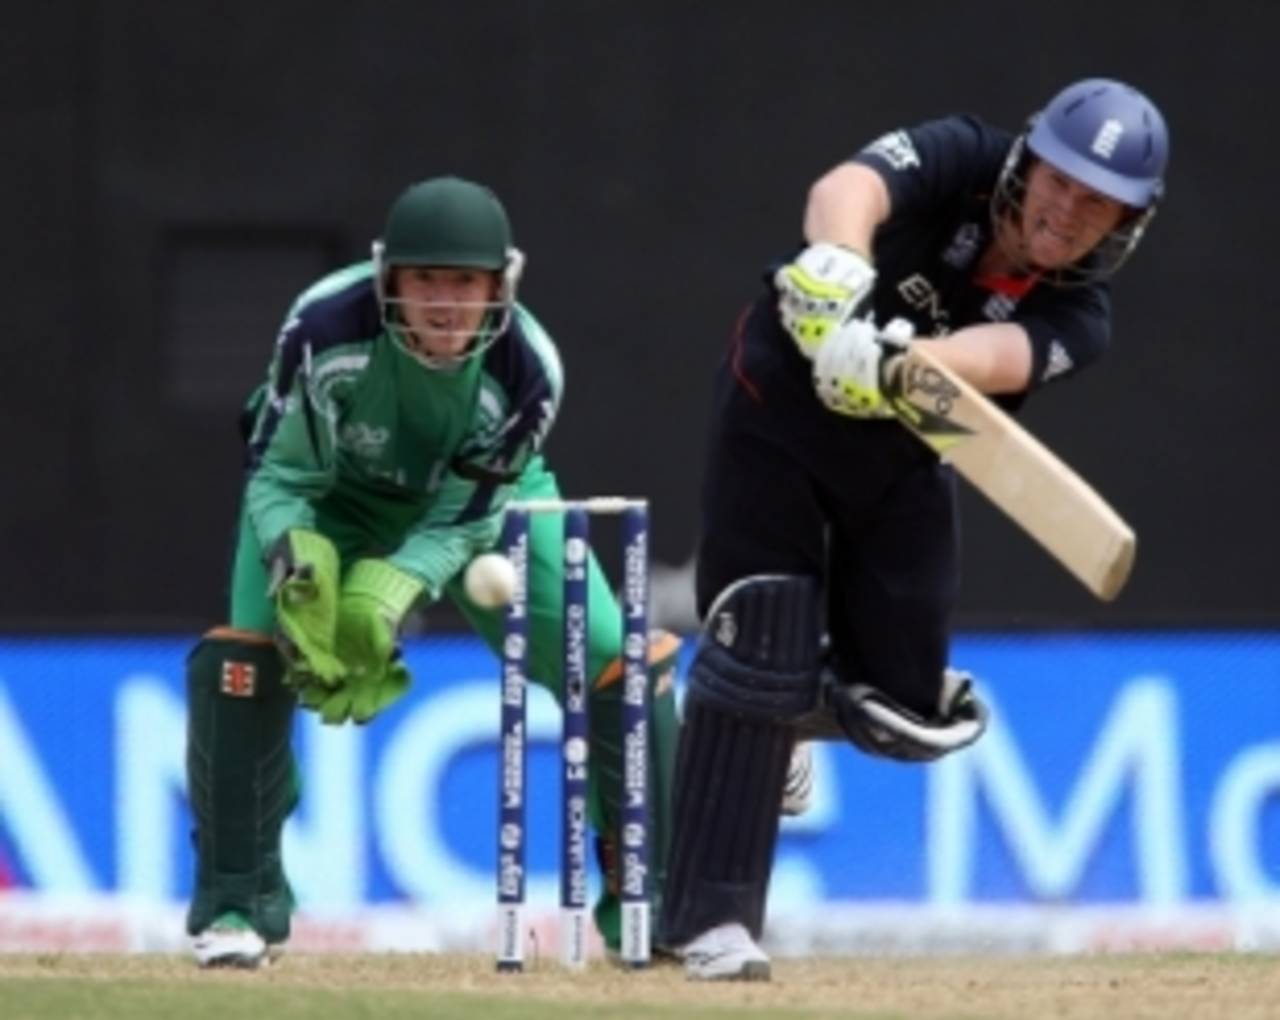
Eoin Morgan averages almost 56 at a strike rate of more than 91 in his 20 ODIs for England • Getty Images
England haven't had it so good as a limited-overs team for a long time. It's no secret that they prefer the longest format of the game, but in recent months the team composition has suited the shorter formats, and the results have followed: they beat South Africa in South Africa late in 2009, won the World Twenty20 earlier this year, and started the five-match series against Australia superbly, chasing down 268 with four overs to spare.
A comparison of their results before and since 2009 illustrates the point: in the four-year period from 2005 to 2008 they won only 37 out of 97 matches, achieving a win-loss ratio of 0.72. Since the beginning of 2009 they've won 16 out of 27, a ratio of 1.45 wins per loss. And this despite very limited contributions from Kevin Pietersen, their best batsman: in the 13 matches he has played, he averages 18.25, with a highest of 48.
During the World Twenty20, Pietersen himself remarked that England's batting line-up had more power-hitters than at any other time in his career, and leading that group has been Eoin Morgan. He has been in irresistible form ever since he moved from Ireland to England, and his unbeaten 103 off a mere 85 balls against Australia was just another example of his batting prowess. He has been at the forefront of England's resurgence as a limited-overs team, and is one of the reasons why they could be among the major contenders for the 2011 World Cup.
| Period | ODIs | Won | Lost | W/L ratio |
| 2005 to 2008 | 97 | 37 | 51 | 0.72 |
| 2009 onwards | 27 | 16 | 11 | 1.45 |
Morgan was a force when he was playing for Ireland as well, but the greater strength of the England team has allowed him to truly flourish. With Ireland, Morgan had the task of holding the line-up together, a responsibility that perhaps affected his ability to bat with abandon. Now, as a part of a more powerful England line-up, he has been expressing himself freely, and the results have been stunning.
In the 20 ODIs he has played for England, Morgan averages an impressive 55.75, at a strike rate of more than 90, both of which are much better than his numbers for Ireland. Both his hundreds for England have also been unbeaten ones, which has further helped boost his average.
| For | ODIs | Runs | Average | Strike rate | 100s/ 50s |
| Ireland | 23 | 744 | 35.42 | 71.67 | 1/ 5 |
| England | 20 | 669 | 55.75 | 91.39 | 2/ 3 |
| Career | 43 | 1413 | 42.81 | 79.83 | 3/ 8 |
Going by his numbers in ODIs so far, Morgan is a better batsman when he bats with a target in front of him. His overall average and strike rate in run-chases are much better than the corresponding numbers when batting first. And in the 12 innings in which he has chased for England, the numbers are unbelievably good.
| ODIs | Runs | Average | Strike rate | 100s/ 50s | |
| Batting first | 22 | 712 | 35.60 | 73.17 | 1/ 4 |
| Batting second | 21 | 701 | 53.92 | 87.95 | 2/ 4 |
| Batting second for England | 12 | 428 | 85.60 | 90.48 | 2/ 1 |
Not surprisingly, England's results when batting second have also improved considerably: in the four years from 2005 to 2008 they won 21 and lost 24; since the beginning of 2009 they've won 10 and lost five (though admittedly three of those wins have come against Bangladesh and Scotland).
During this one-year period from May 2009, Morgan ranks among the top ODI batsmen, with only five players having a higher average. Another England batsman, Paul Collingwood, is in the top eight as well, and the consistency of these two has been a huge factor in England's success.
| Batsman | ODIs | Runs | Average | Strike rate | 100s/ 50s |
| AB de Villiers | 16 | 855 | 71.25 | 103.38 | 4/ 4 |
| Sachin Tendulkar | 17 | 914 | 65.28 | 98.91 | 3/ 2 |
| MS Dhoni | 30 | 1170 | 61.57 | 84.47 | 3/ 6 |
| Hashim Amla | 13 | 797 | 61.30 | 90.67 | 2/ 5 |
| Tillakaratne Dilshan | 22 | 1198 | 59.90 | 107.83 | 5/ 4 |
| Eoin Morgan | 20 | 669 | 55.75 | 91.39 | 2/ 3 |
| Paul Collingwood | 19 | 761 | 54.35 | 80.18 | 1/ 4 |
| Virat Kohli | 25 | 895 | 49.72 | 83.95 | 2/ 7 |
| Michael Clarke | 21 | 826 | 48.58 | 71.51 | 1/ 6 |
| Michael Hussey | 34 | 1166 | 48.58 | 94.03 | 0/ 9 |
Morgan's success in the ODI format has drawn comparisons with the two Michaels, Hussey and Bevan, so here's a look at how much they had achieved at similar stages of their careers (in terms of matches played). Morgan's played 43 ODIs in all, and 20 for England, so the table below lists the stats for Bevan and Hussey after they'd played those many games. Hussey's average is incredibly high due to the not-outs - in his first 20 games he was dismissed only four times - but Bevan's numbers are closer to Morgan's, though Morgan's strike rate is much higher.
| Batsman | Runs | Average | Strike rate | 100s/ 50s |
| Bevan - 20 ODIs | 621 | 69.00 | 77.43 | 0/ 2 |
| Hussey - 20 ODIs | 516 | 129.00 | 94.85 | 0/ 4 |
| Bevan - 43 ODIs | 1256 | 54.60 | 76.49 | 0/ 8 |
| Hussey - 43 ODIs | 1308 | 81.75 | 99.01 | 1/ 9 |
Morgan's boundary-hitting capability has been one of the impressive aspects of his batting. In his 20 innings for England he has scored about half his runs in fours and sixes, which is pretty impressive considering he bats during a period when the field is usually spread out. (Collingwood gets only 42% of his runs in fours and sixes.) The percentage is considerably lower than those for Chris Gayle and Shahid Afridi, but England will settle for that. If Pietersen finds his ODI form and Morgan continues this run-scoring spree, England could be a pretty dangerous unit come World Cup 2011.
| Batsman | Innings | Runs | 4s/ 6s | % runs in 4s & 6s |
| Chris Gayle | 21 | 626 | 72/ 19 | 64.22 |
| Tillakaratne Dilshan | 22 | 1198 | 166/ 13 | 61.94 |
| Shahid Afridi | 21 | 620 | 61/ 23 | 61.61 |
| Shane Watson | 35 | 1476 | 164/ 29 | 56.23 |
| Tamim Iqbal | 26 | 965 | 106/ 18 | 55.13 |
| Sachin Tendulkar | 16 | 914 | 109/ 9 | 53.61 |
| Upul Tharanga | 23 | 952 | 108/ 11 | 52.31 |
| Tim Paine | 19 | 605 | 71/ 5 | 51.90 |
| Eoin Morgan | 20 | 669 | 65/ 13 | 50.52 |
| Suresh Raina | 25 | 792 | 65/ 19 | 47.22 |
All stats updated till June 22.
S Rajesh is stats editor of Cricinfo