Pakistan and their batting worries
Over the last couple of years, Pakistan have had several batting debacles which have cost them Tests. A look at the chief culprits, and a comparison with other teams
S Rajesh
15-Jan-2010
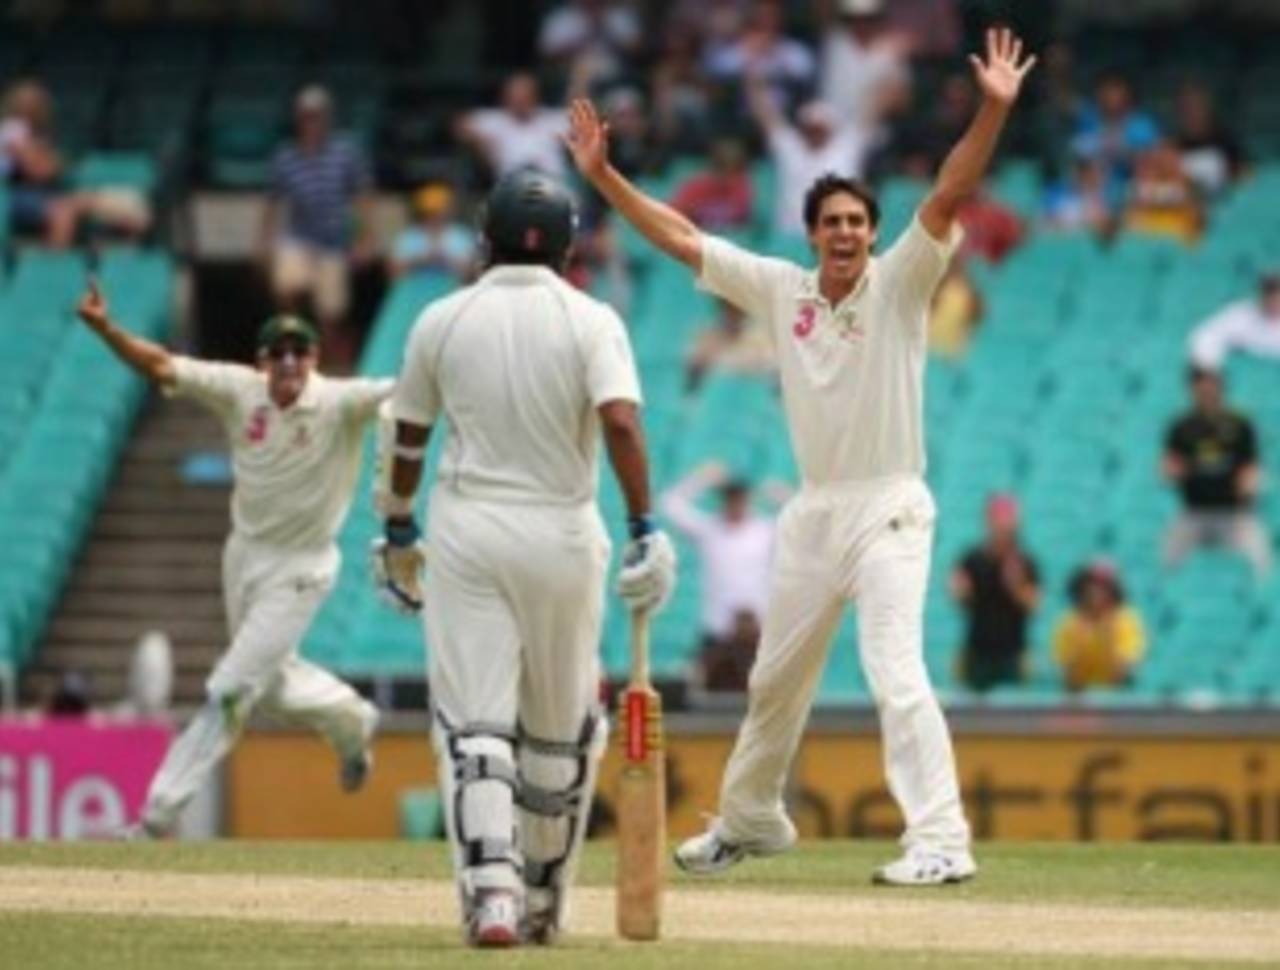
Salman Butt averages 12.27 in his last 11 fourth-innings knocks • Getty Images
The year 2009 hasn't been a good time to be a supporter of Pakistan Test cricket. The limited-overs teams have won laurels, but the Test side has lurched from one disaster to another. More than just the number of defeats, it's the manner of those losses which have been shattering: in July they were bundled out for 117 chasing 168, in November they fell for 218 chasing 251, and in January they managed 139 chasing 176. It's a pattern that has been depressing, and depressingly familiar.
Since 2007, Pakistan have had a forgettable time in Test cricket, winning two out of 18 Tests and losing nine. Much of the attention has been focussed on the batsmen, and while they've been quite poor during this three-year period, the team hasn't done better in the field either. Pakistan's batting average of 31.10 runs per wicket is better than only three teams - New Zealand, West Indies and Bangladesh - but they've also conceded 39.29 runs per wicket with the ball, which is third from the bottom (though much of it would be due to the number of catches spilled).
A good indicator of the batting and bowling prowess of a team is the number of times it scores and concedes 400 or more runs in an innings, and Pakistan have conceded those many almost twice the number of times they've scored them. Four of their five 400-plus scores have come in the subcontinent - in Kolkata, Bangalore, Karachi, and Colombo. (Click here for the full list of scores.) As a bowling unit, though, they've been profligate, conceding more than 600 four times during this period, and giving away more than 400 on four other occasions. (Click here for the full list.) And while Pakistan's five 400-plus totals have spanned 18 Tests - an average of one every 3.6 matches - teams like India and Australia have averaged one such score every 1.5 Tests.
| Team | Tests | Won/ lost | Bat ave | Scored>=400 | Bowl ave | Conceded >=400 |
| Sri Lanka | 25 | 13/ 6 | 44.12 | 16 | 33.53 | 9 |
| India | 31 | 12/ 6 | 42.25 | 20 | 36.60 | 12 |
| Australia | 32 | 17/ 8 | 40.73 | 21 | 33.16 | 12 |
| South Africa | 31 | 18/ 8 | 39.27 | 15 | 29.60 | 8 |
| England | 38 | 13/ 9 | 37.12 | 12 | 35.73 | 17 |
| Pakistan | 18 | 2/ 9 | 31.10 | 5 | 39.29 | 9 |
| West Indies | 26 | 3/ 14 | 30.49 | 5 | 43.06 | 15 |
| New Zealand | 24 | 5/ 12 | 28.79 | 5 | 34.10 | 9 |
| Bangladesh | 17 | 2/ 13 | 20.57 | 1 | 44.68 | 9 |
Ironically, Pakistan's best batsman during this period has been the one who has been dropped from the team due to poor form. Younis Khan is the only one who has scored four Test hundreds during the last three years. In 23 innings he has eight 50-plus scores and an average touching 57. Umar Akmal averages 55.50, but he has only played six Tests. Mohammad Yousuf's average has slipped to marginally below 40, while the openers both average less than 35, which explains Pakistan's batting worries.
| Batsman | Tests | Runs | Average | 100s/ 50s |
| Younis Khan | 13 | 1195 | 56.90 | 4/ 4 |
| Umar Akmal | 6 | 555 | 55.50 | 1/ 4 |
| Misbah-ul-Haq | 14 | 888 | 42.28 | 2/ 4 |
| Mohammad Yousuf | 15 | 999 | 39.96 | 1/ 6 |
| Kamran Akmal | 18 | 1169 | 38.96 | 2/ 8 |
| Shoaib Malik | 11 | 499 | 33.26 | 1/ 2 |
| Imran Farhat | 9 | 498 | 33.20 | 1/ 3 |
| Salman Butt | 13 | 661 | 30.04 | 0/ 4 |
| Faisal Iqbal | 9 | 361 | 25.78 | 0/ 3 |
In fact, Pakistan's batting averages have risen and sunk with Yousuf's stats: in 2005 and 2006, when Yousuf was in form, Pakistan had a healthy batting average. In 2007 and in 2009, though, Yousuf slipped, and so did Pakistan's batting stats.
| Year | Pakistan - runs per wkt | Yousuf - average |
| 2005 | 37.91 (9 Tests, 4W, 3L, 2D)) | 51.41 (7 Tests) |
| 2006 | 43.65 (12 Tests, 4W, 3L, 5D) | 99.33 (11 Tests) |
| 2007 | 30.97 (8 Tests, 1W, 4L, 3D) | 40.88 (6 Tests) |
| 2009 & 10 | 31.20 (10 Tests, 1W, 5L, 4D) | 39.43 (9 Tests) |
Much of Pakistan's recent woes have been due to their fourth-innings debacles when chasing fairly low targets. It hasn't been a recent phenomenon either: since 2004 they've batted in the fourth innings on 20 occasions, and lost ten times. Their lowest point was in Perth in 2004-05, when they were skittled out in 31.3 overs, for 72. Apart from that they've been dismissed for less than 160 three times, and with 260 on four other occasions. Nine times - which is almost 50% of the matches during this period - they've fallen in less than 90 overs. On the other hand, only twice have they batted more than 100 overs - against Sri Lanka in Colombo in 2006, and against South Africa in Lahore in 2007.
Overall, Pakistan average 27.66 during this period, which is the lowest fourth-innings average among all teams. And while Australia last 107 overs to lose those ten wickets (at an average of 39.28 runs per wicket) and South Africa last 124.3 overs, Pakistan's average is a mere 87.5, which is a figure propped up by the few occasions when their top-order batsmen saved matches or chased smallish targets without losing too many wickets.
| Team | Tests | Average | Run rate | 100s/ 50s | Ave overs per inngs* |
| Australia | 24 | 39.28 | 3.67 | 6/ 20 | 107.0 |
| South Africa | 25 | 38.18 | 3.07 | 5/ 35 | 124.3 |
| England | 29 | 32.79 | 3.08 | 5/ 24 | 106.3 |
| Sri Lanka | 17 | 32.25 | 3.23 | 4/ 19 | 99.4 |
| India | 23 | 31.32 | 3.19 | 3/ 18 | 98.1 |
| Bangladesh | 6 | 31.30 | 2.93 | 2/ 7 | 106.5 |
| New Zealand | 19 | 30.01 | 3.21 | 2/ 18 | 93.3 |
| West Indies | 22 | 29.45 | 3.10 | 5/ 27 | 94.5 |
| Pakistan | 20 | 27.66 | 3.15 | 5/ 17 | 87.5 |
And now a look at Pakistan's best fourth-innings batsmen in these last six years. Shoaib Malik and Younis, two batsmen who've been out of favour recently, lead the way. Malik's average of 85.50 is also because of his three not-outs, though he did score a marathon unbeaten 148 to save the Colombo Test against Sri Lanka. Younis is the only other batsman with a 40-plus average, with five 50-plus scores in 14 innings, including a hat-trick of centuries.
Some of the other batsmen, though, have woeful stats: in 17 fourth innings between them, Salman Butt and Misbah-ul-Haq have zero half-centuries, and a highest score of 37. Not surprisingly, they average slightly over 12 runs per innings.
| Batsman | Innings | Runs | Average | 100s/ 50s |
| Shoaib Malik | 7 | 342 | 85.50 | 1/ 2 |
| Younis Khan | 14 | 586 | 58.60 | 3/ 2 |
| Mohammad Yousuf | 15 | 432 | 39.27 | 0/ 2 |
| Faisal Iqbal | 7 | 269 | 38.42 | 0/ 2 |
| Inzamam-ul-Haq | 8 | 161 | 23.00 | 0/ 1 |
| Imran Farhat | 12 | 249 | 22.63 | 0/ 2 |
| Kamran Akmal | 14 | 277 | 21.30 | 0/ 2 |
| Yasir Hameed | 7 | 118 | 19.67 | 0/ 0 |
| Salman Butt | 11 | 135 | 12.27 | 0/ 0 |
| Misbah-ul-Haq | 6 | 73 | 12.16 | 0/ 0 |
S Rajesh is stats editor of Cricinfo