Two captains, one milestone
Michael Clarke has the better overall average, while Alastair Cook's overseas record is better; both are among the best their countries have produced
S Rajesh
13-Dec-2013
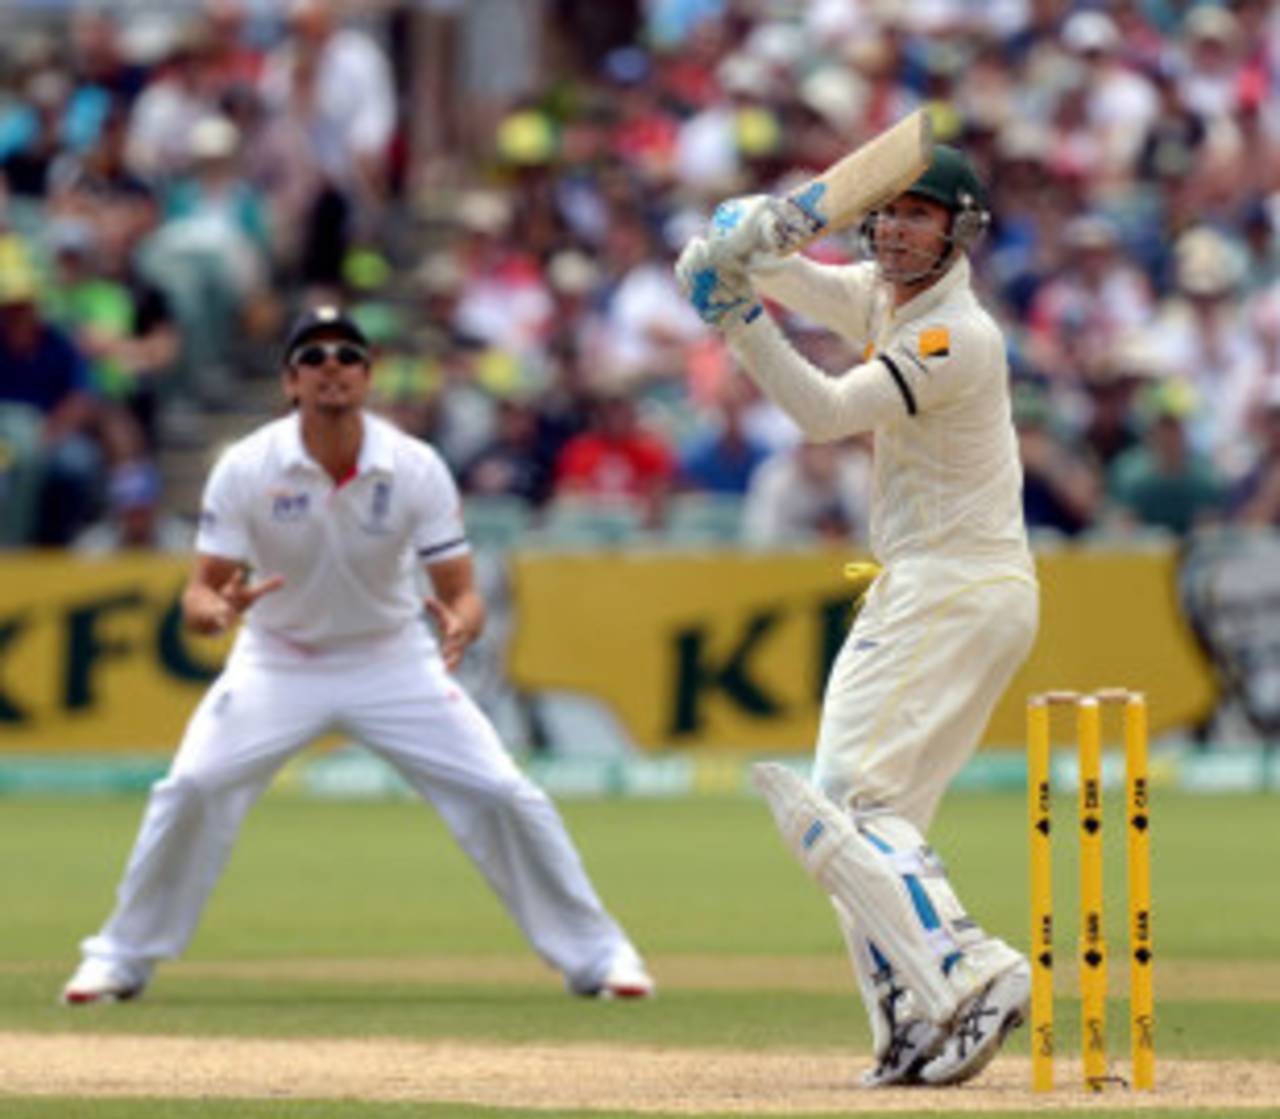
Only a couple of batsmen from each of their teams have averaged more than Michael Clarke and Alastair Cook after 99 Tests • PA Photos
Both these players started their Test careers in India -17 months apart - scored centuries on debuts, developed into prolific batsmen and strong leaders, and on Friday in Perth, joined 56 others who've played 100 Test matches. Michael Clarke has become the 12th Australian, and Alastair Cook the 11th from England in this club, and while currently the stars are in the ascendancy for Clarke, overall there isn't a whole lot to separate the two players. Clarke has scored 57 more runs than Cook and also one extra century, but before this series began Cook had the lead on both counts, by 145 runs and one hundred.
Clarke is the one with the 50-plus average while Cook is currently on 47.20, but from the moment both made their debuts it was clear that they were destined for great things. Clarke was magnificent against India's spinners in Bangalore in 2004: of the 151 he scored on debut, 109 were scored off Anil Kumble and Harbhajan Singh. Australia won the Test, and the knock was enough to win Clarke the Man-of-the-Match award, making him only the third Australian to win it on debut.
Cook's unbeaten 104, in a drawn game in Nagpur, wasn't as decisive in the context of the match, but he became only the seventh England opener to score a century on Test debut. Since then, he has been a fixture in the England team, missing only one Test - the third match of the same series, due to a stomach bug. That means he has played 97 Tests in a row (the Perth Test is his 98th in succession), and if he stays fit through the rest of the series, the Sydney Test will be his 100th in a row, making him only the fourth cricketer to achieve this feat, after Allan Border, Mark Waugh and Sunil Gavaskar. Clarke, on the other hand, has missed nine Tests since his debut.
Along with his ability to stay injury-free, Cook has also benefited from England's busy Test schedule: since his debut, England have played 100 Tests, while the next-best is Australia's 84. (Pakistan have played 59 during the same period, which indicates how lopsided the schedules are.)
As must happen when a player's been around for so many matches, both Clarke and Cook have had their ups and downs. Despite an outstanding start to his career - he also scored a hundred in his first home Test later that year - Clarke didn't immediately achieve the sort of consistency expected from a top-notch batsman: after his first 22 Tests, he averaged 36; Cook, on the other hand, had a pretty good first couple of years, averaging 45 after his first 24 matches.
Thereafter, though, from 2008 to the middle of 2010, Clarke had an outstanding period, averaging 60 from 38 Tests, while Cook's numbers dropped slightly. After 60 Tests, Clarke averaged 51.47 to Cook's 42.78. Thereafter, it was Cook's turn to soar while Clarke had a dip in form: the 2010-11 Ashes was Cook's best series, while Clarke collected 193 runs in nine innings, which was fewer than Cook's highest score in the series. In the last couple of years, though, Clarke has been magnificent once again, while Cook, after a stunning two-and-a-half years, has dropped off in the last six months, averaging only 25 in seven Tests against Australia.
| Period | Tests | Runs | Average | Strike rate | 100s/ 50s |
| Till April 2006 | 22 | 1123 | 36.22 | 54.51 | 2/ 4 |
| May 2006 to Apr 2010 | 38 | 3252 | 60.22 | 53.24 | 12/ 14 |
| May 2010 to Dec 2011 | 17 | 940 | 30.32 | 53.53 | 3/ 3 |
| Jan 2012 onwards | 22 | 2625 | 75.00 | 62.42 | 9/ 6 |
| Career | 99 | 7940 | 52.58 | 56.19 | 26/ 27 |
| Period | Tests | Runs | Average | Strike rate | 100s/ 50s |
| Till Dec 2007 | 24 | 1936 | 45.02 | 46.12 | 7/ 8 |
| Jan 2008 to Aug 2010 | 36 | 2428 | 41.15 | 50.25 | 6/ 14 |
| Sep 2010 to May 2013 | 32 | 3160 | 61.96 | 46.49 | 12/ 7 |
| June 2013 onwards | 7 | 359 | 25.64 | 35.75 | 0/ 4 |
| Career | 99 | 7883 | 47.20 | 46.84 | 25/ 33 |
Cream of the crop
Both players are clearly among the best batsmen that their countries have produced. With a 5000-run cut-off, only two Australians, Don Bradman and Greg Chappell, have a higher average than Clarke's 52.58. However, for several of them, the averages dipped towards the end of their careers. Among Australians who played 100 or more Tests, Ricky Ponting had the best average after 99 matches - 56.26. His career average fell to 51.85 because of an extended poor run at the end, while Allan Border and Matthew Hayden both averaged more than 52 after 99, but finished with career averages of slightly over 50.
Both players are clearly among the best batsmen that their countries have produced. With a 5000-run cut-off, only two Australians, Don Bradman and Greg Chappell, have a higher average than Clarke's 52.58. However, for several of them, the averages dipped towards the end of their careers. Among Australians who played 100 or more Tests, Ricky Ponting had the best average after 99 matches - 56.26. His career average fell to 51.85 because of an extended poor run at the end, while Allan Border and Matthew Hayden both averaged more than 52 after 99, but finished with career averages of slightly over 50.
| Batsman | Runs | Average | 100s/ 50s |
| Ricky Ponting | 7990 | 56.26 | 26/ 32 |
| Allan Border | 7650 | 52.75 | 23/ 35 |
| Michael Clarke | 7640 | 52.58 | 26/ 27 |
| Matthew Hayden | 8484 | 52.04 | 30/ 29 |
| Steve Waugh | 6203 | 49.23 | 14/ 36 |
| Justin Langer | 7393 | 45.35 | 22/ 29 |
| Mark Taylor | 7297 | 44.76 | 19/ 38 |
| David Boon | 7067 | 44.72 | 20/ 31 |
| Mark Waugh | 6371 | 41.64 | 17/ 37 |
Among England batsmen who've scored at least 5000 runs, seven have a better average than Cook, but five of them played all their cricket before 1970. Among the more recent England batsmen, only Kevin Pietersen, who played his 100th at the Gabba, and Geoff Boycott have better averages - and that too by a fraction of a run - than Cook. After 99 Tests, they're the only ones with better averages than Cook's.
| Batsman | Runs | Average | 100s/ 50s |
| Geoff Boycott | 7441 | 48.63 | 20/ 39 |
| Kevin Pietersen | 7887 | 48.38 | 23/ 33 |
| Alastair Cook | 7883 | 47.20 | 25/ 33 |
| Colin Cowdrey | 6940 | 46.57 | 20/ 37 |
| David Gower | 6985 | 44.49 | 14/ 35 |
| Graham Thorpe | 6678 | 44.22 | 16/ 38 |
| Graham Gooch | 7573 | 43.77 | 17/ 41 |
| Andrew Strauss | 7016 | 41.27 | 21/ 27 |
| Alec Stewart | 6733 | 40.56 | 13/ 35 |
| Michael Atherton | 6713 | 38.14 | 14/ 40 |
Between the two, Cook has had a higher percentage of below-par series, which explains why his overall average is lower by about five runs. Out of 22 series of three of more Tests he has played so far, Cook has averaged less than 35 in eight of those, compared to five for Clarke. Clarke's had a higher percentage of prolific series as well, with five instances of 75-plus averages, compared to three for Cook. (Click here for the series-wise averages of Clarke, and here for Cook's series-wise stats.) Clarke also leads Cook 7-5 in terms of Man-of-the-Match awards, and has won five Player-of-the-Series awards to Cook's two.
| Less than 35 | 35 to 49.99 | 50 to 74.99 | 75 and above | |
| Michael Clarke | 5 | 6 | 4 | 5 |
| Alastair Cook | 8 | 7 | 4 | 3 |
The Asia factor
Clarke has been outstanding in home conditions, averaging more than 65 in 49 Tests, but in terms of overseas numbers Cook has done much better. In fact, Clarke's away stats are comparable with Cook's home numbers - both averages are in the early 40s.
Clarke has been outstanding in home conditions, averaging more than 65 in 49 Tests, but in terms of overseas numbers Cook has done much better. In fact, Clarke's away stats are comparable with Cook's home numbers - both averages are in the early 40s.
Cook's patience and his ability to bat long periods have been particularly beneficial in Asia, where the slower pitches often require batsmen to spend plenty of time at the crease and accumulate runs. Cook's overall average in Asia is 56.31; excluding Tests in Bangladesh it's 50.34. Clarke's had his bright moments in Asia, but his overall average is ten runs lower.
| Home | Away | |||||
| Batsman | Tests | Average | 100s/ 50s | Tests | Average | 100s/ 50s |
| Michael Clarke | 49 | 65.29 | 16/ 13 | 50 | 42.16 | 10/ 14 |
| Alastair Cook | 54 | 43.35 | 11/ 17 | 45 | 51.70 | 14/ 16 |
| Batsman | Tests | Runs | Average | Strike rate | 100s/ 50s |
| Michael Clarke | 16 | 1186 | 40.89 | 51.54 | 4/ 5 |
| Alastair Cook | 16 | 1460 | 50.34 | 41.18 | 5/ 7 |
Among batsmen from outside Asia who've scored at least 800 runs in Asia (excluding Bangladesh) since 2004, Cook is one of five who averages more than 50. The two other England batsmen who've been around for a while - Pietersen and Ian Bell - have much poorer averages, with Bell's 31.17 being surprisingly low for a player with such class and feel. The top three in the list are all South Africans, and they all average more than 65, which is one of the main reasons why South Africa have done so well in Asia over the last few years.
| Batsman | Tests | Runs | Average | 100s/ 50s |
| Jacques Kallis | 15 | 1507 | 68.50 | 8/ 5 |
| AB de Villiers | 13 | 1301 | 68.47 | 3/ 5 |
| Hashim Amla | 13 | 1382 | 65.80 | 6/ 5 |
| Michael Hussey | 9 | 956 | 59.75 | 3/ 5 |
| Alastair Cook | 16 | 1460 | 50.34 | 5/ 7 |
| Graeme Smith | 15 | 1281 | 49.26 | 3/ 5 |
| Shivnarine Chanderpaul | 12 | 802 | 44.55 | 1/ 4 |
| Simon Katich | 11 | 835 | 41.75 | 1/ 5 |
| Michael Clarke | 16 | 1186 | 40.89 | 4/ 5 |
| Kevin Pietersen | 20 | 1323 | 36.75 | 4/ 4 |
| Ricky Ponting | 12 | 835 | 36.30 | 1/ 5 |
| Ian Bell | 19 | 1060 | 31.17 | 2/ 7 |
Leading by example
Cook's been better in the subcontinent, but Clarke's batting stats since he has taken over captaincy is unmatched. In 31 Tests as captain, he averages more than 63, which is the best among all captains who've led in at least 25 Tests. (Bradman captained 24 times and averaged 101.51 in those matches.)
Cook's been better in the subcontinent, but Clarke's batting stats since he has taken over captaincy is unmatched. In 31 Tests as captain, he averages more than 63, which is the best among all captains who've led in at least 25 Tests. (Bradman captained 24 times and averaged 101.51 in those matches.)
The table below lists the top ten batting averages of captains, and several of the modern-day captains aren't in the list below. (Click here for the full list.) In 48 Tests as captain, Imran Khan averaged 52.34, which is more than what Inzamam-ul-Haq, Steve Waugh, Ricky Ponting, Sachin Tendulkar, Clive Lloyd, Border, Sunil Gavaskar and Javed Miandad averaged as captains.
Cook has had a poor time with the bat in the last two series, but in the 18 Tests he has captained so far his stats are pretty good too - an average of 50.60, with seven hundreds.
| Batsman | Tests | Runs | Average | 100s/ 50s |
| Michael Clarke | 31 | 3243 | 63.58 | 12/ 7 |
| Mahela Jayawardene | 38 | 3665 | 59.11 | 14/ 10 |
| Garry Sobers | 39 | 3528 | 58.80 | 11/ 15 |
| Graham Gooch | 34 | 3582 | 58.72 | 11/ 16 |
| Brian Lara | 47 | 4685 | 57.83 | 14/ 19 |
| Greg Chappell | 48 | 4209 | 55.38 | 13/ 19 |
| Bob Simpson | 39 | 3623 | 54.07 | 10/ 16 |
| Peter May | 41 | 3080 | 54.03 | 10/ 15 |
| Ted Dexter | 30 | 2427 | 53.93 | 4/ 17 |
| Imran Khan | 48 | 2408 | 52.34 | 5/ 14 |
Star at No. 5
For much of his Test career, Clarke has batted at No. 5, though he has recently moved up to four after the retirement of Ricky Ponting and Michael Hussey. At No. 5, Clarke has scored 5829 runs from 102 innings at an average of 64.05. Only two batsmen - Steve Waugh and Shivnarine Chanderpaul - have scored more runs than him at No. 5; among those who've batted at least 50 times at this position, only AB de Villiers has a better average (67.70).
For much of his Test career, Clarke has batted at No. 5, though he has recently moved up to four after the retirement of Ricky Ponting and Michael Hussey. At No. 5, Clarke has scored 5829 runs from 102 innings at an average of 64.05. Only two batsmen - Steve Waugh and Shivnarine Chanderpaul - have scored more runs than him at No. 5; among those who've batted at least 50 times at this position, only AB de Villiers has a better average (67.70).
Moreover, Clarke revelled at this position when the team had lost early wickets. His highest Test score of 329 not out, against India in Sydney in 2012, came from an entry score of 37 for 3; his second-highest Test score, 259 not out against South Africa later in the same year in Brisbane, started from a team score of 40 for 3; in the next Test, in Adelaide, Australia were 55 for 3 when he came in and scored 230, his third-highest Test score. And then there was his 151 out of a team total of 284 in Cape Town - arguably his finest Test innings - when he came in at 40 for 3. Overall, in the 18 innings when he came in to bat with the score reading three down for 50 or fewer runs, he averaged 84. His lowest point-of-entry average was when he came in after Australia's first three wickets had already put together more than 225 runs on the board.
At No. 4 Clarke hasn't had as much success, averaging only 30 from 40 innings, but things have improved in 2013: in 12 innings at No. 4 this year he has averaged 50.58, and scored more runs than he did in 28 innings at this slot in all the previous years.
| Entry score | Innings | Runs | Average | 100s/ 50s |
| 50 or less | 18 | 1262 | 84.13 | 3/ 4 |
| 51 to 100 | 26 | 1543 | 61.72 | 5/ 4 |
| 101 to 150 | 24 | 1313 | 62.52 | 5/ 5 |
| 151 to 225 | 18 | 1011 | 63.19 | 5/ 3 |
| 226 and above | 16 | 700 | 50.00 | 2/ 4 |
S Rajesh is stats editor of ESPNcricinfo. Follow him on Twitter