Point to prove for England and Hussey
Australia have won nine of their last ten Tests at the MCG, but Michael Hussey hasn't had a good time at this ground
S Rajesh
24-Dec-2010
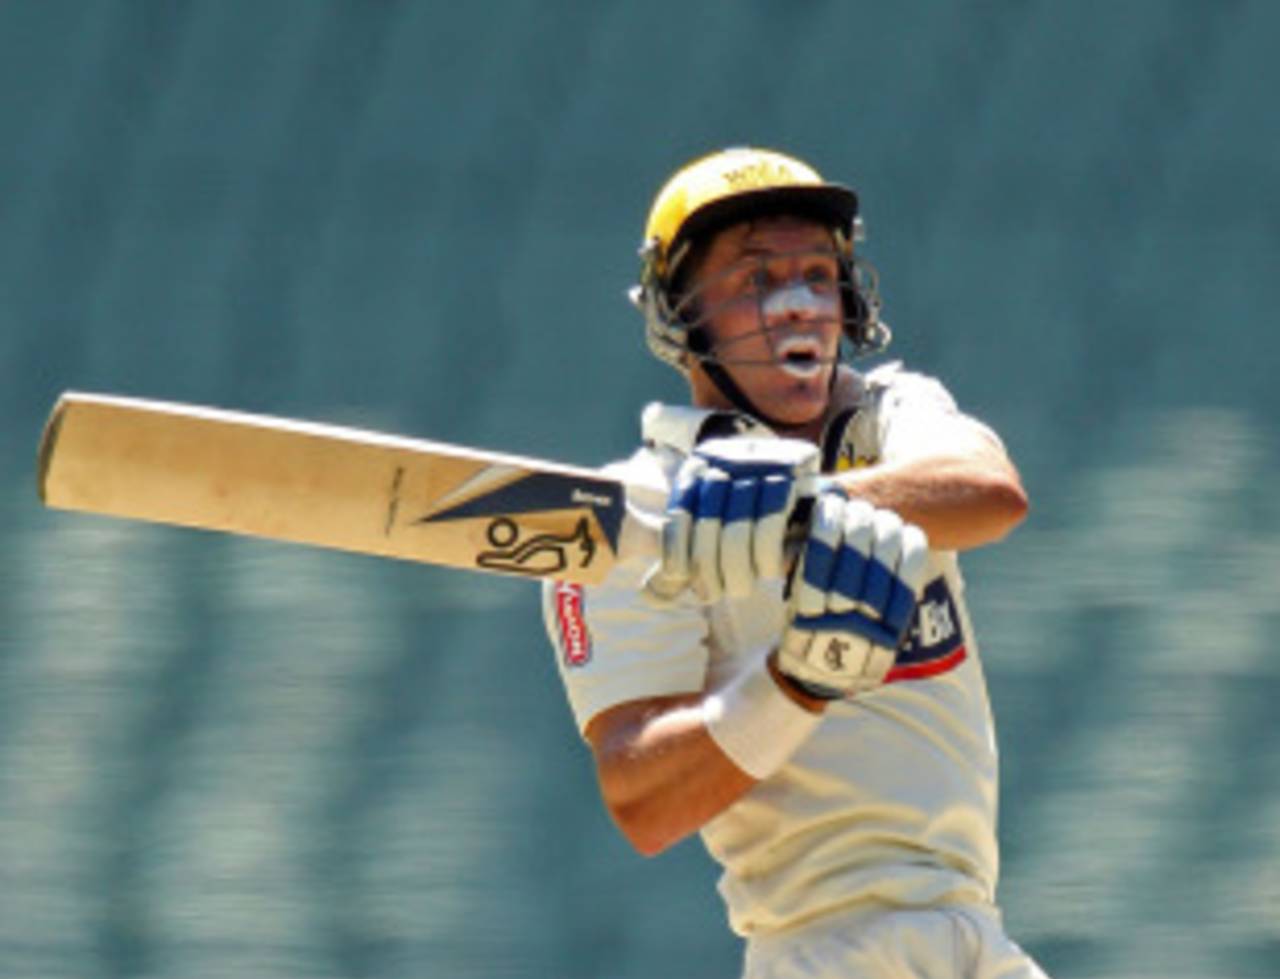
Michael Hussey averages 31.67 at the MCG, which is the only Australian venue where his average dips below 50 • Getty Images
Australia's emphatic Perth victory might not have been a great result for the England fans, but from the neutral's point of view, it was the perfect result to liven up the series. With two Tests to go, the onus remains on Australia to wrest back the Ashes - they need to win at least one and draw the other - but they'll be pleased that these two matches will be played in Melbourne and Sydney, grounds where they have terrific recent records. At the MCG, Australia have won nine and lost one of their last ten Tests - in terms of win-loss records at home venues over the last decade, it's among the best.
On the other hand, England have won only one of their last five Tests here, in 1998, when they won by 12 runs. In 2006, they suffered a heavy defeat, by an innings and 99 runs.
There's been much talk about a slow pitch waiting for both teams, but if past results are any indication, there'll still be a result: the last 12 matches have all produced decisive results, as have 20 of the last 22, going back all the way to 1988. Both draws during this period have been in matches against South Africa, in 1993 and 1997.
| Tests | Won | Lost | Drawn | |
| Australia - since 2000 | 10 | 9 | 1 | 0 |
| England - since 1990 | 5 | 1 | 4 | 0 |
The stats below further demonstrate how Australia have been so dominant with both bat and ball over the last ten years, and how England have struggled in the last couple of decades. Of course, through most of that time Australia had a side that was almost unrecognisable from the team they have now, but these are imposing numbers nonetheless.
With the bat, Australia have averaged more than 42, with 15 centuries scored in ten Tests. England will be thankful that Australia's left-hand opening batsman today is considerably less imposing than Matthew Hayden used to be. Hayden was absolutely irresistible at the MCG, scoring six hundreds in nine Tests between 2000 and 2008. Ricky Ponting was pretty good too with three centuries, and the performances of those two meant that Australia's average partnership for the second wicket at this ground in the last ten years is 65.87, with Hayden and Ponting averaging 142.80 in eight innings. With Ponting in a slump and Hayden not around anymore, England can probably breathe a little easier.
With the ball, Australia have averaged 26 runs per wicket, which means they've scored 16 runs per wicket more than they've conceded, which is exactly the reverse of England's situation. In the last 20 years, they've only managed three hundreds here - Alec Stewart, David Gower and Michael Vaughan being the centurions - while they've struggled with the ball, conceding more than 37 runs per wicket.
| Runs scored | Average | 100s scored | Wkts taken | Bowl ave | 100s conceded | |
| Australia - since 2000 | 5721 | 42.06 | 15 | 182 | 26.00 | 4 |
| England - since 1990 | 2143 | 21.43 | 3 | 69 | 37.49 | 6 |
Among the current Australian batsmen, Ponting has easily been the best of the lot at this venue, averaging more than 62, while Shane Watson's only Test century at home has come here, against Pakistan last year.
The batsman who has done surprisingly poorly in Melbourne is Australia's Man of the Moment, Michael Hussey. The pace of Perth obviously suits him perfectly, but the sluggish pitches at the MCG haven't quite been to his liking. He began with a century here in his first Test innings here, but eight subsequent innings have only fetched him 163, for an overall average of 31.67. In fact, among all the home venues he has played in, Melbourne is the only one where he averages less than 50.
| Batsman | Tests | Runs | Average | 100s/ 50s |
| Shane Watson | 1 | 213 | 213.00 | 1/ 1 |
| Ricky Ponting | 13 | 1186 | 62.42 | 4/ 5 |
| Michael Clarke | 5 | 300 | 50.00 | 0/ 2 |
| Michael Hussey | 5 | 285 | 31.67 | 1/ 1 |
| Brad Haddin | 2 | 50 | 16.67 | 0/ 0 |
Among the specialist bowlers in Australia's current squad, only two have played a Test in Melbourne. Mitchell Johnson's 11 wickets have come at 26.45 apiece, but perhaps even more impressive is the amount of control he has been able to exert. Johnson's economy rate at this ground is 2.46, which is easily his best among venues where he has played more than one Test. In fact, it's the only ground where he has played more than one Test and maintained an economy rate of less than three runs per over. In his most recent Test at the MCG, against Pakistan last year, his first-innings figures read 22-10-36-3, and he had match figures of 6 for 82 off 40 overs. Another similar performance will do nicely for Australia.
| Bowler | Tests | Wickets | Average | Strike rate | 5WI/ 10WM |
| Mitchell Johnson | 3 | 11 | 26.45 | 64.3 | 0/ 0 |
| Peter Siddle | 2 | 6 | 37.33 | 85.0 | 0/ 0 |
Despite the slightly slow nature of pitches, fast bowlers have still done better than spinners here over the last ten years. Fast bowlers average almost 32 runs per wicket, while spinners concede almost 40 runs per wicket. Of the six five-fors by spinners, five have been achieved by wristspinners - two by Anil Kumble, and one each by Shane Warne, Stuart MacGill and Danish Kaneria. The only finger-spinner to get a five-for here during this period is Nathan Hauritz, who took 5 for 101 against Pakistan last year, despite which the selectors have, in their infinite wisdom, decided to ignore him.
| Wickets | Average | Strike rate | 5WI/ 10WM | |
| Pace | 219 | 31.99 | 62.8 | 6/ 1 |
| Spin | 82 | 39.98 | 72.1 | 6/ 0 |
The average runs per wicket scored in each innings of MCG Tests suggests that batting first is the best option here. Teams average almost 40 runs per wicket in the first innings, but it drops to 25 in the fourth innings. Not surprisingly, in the last eight Tests here, teams winning the toss have chosen to bat.
| 1st innings | 2nd innings | 3rd innings | 4th innings |
| 39.60 | 35.02 | 30.13 | 25.02 |
S Rajesh is stats editor of Cricinfo