New highs for England, new lows for Australia
Alastair Cook and James Anderson were the star performers in an outstanding Ashes campaign, while Australia had few memorable moments
S Rajesh
08-Jan-2011
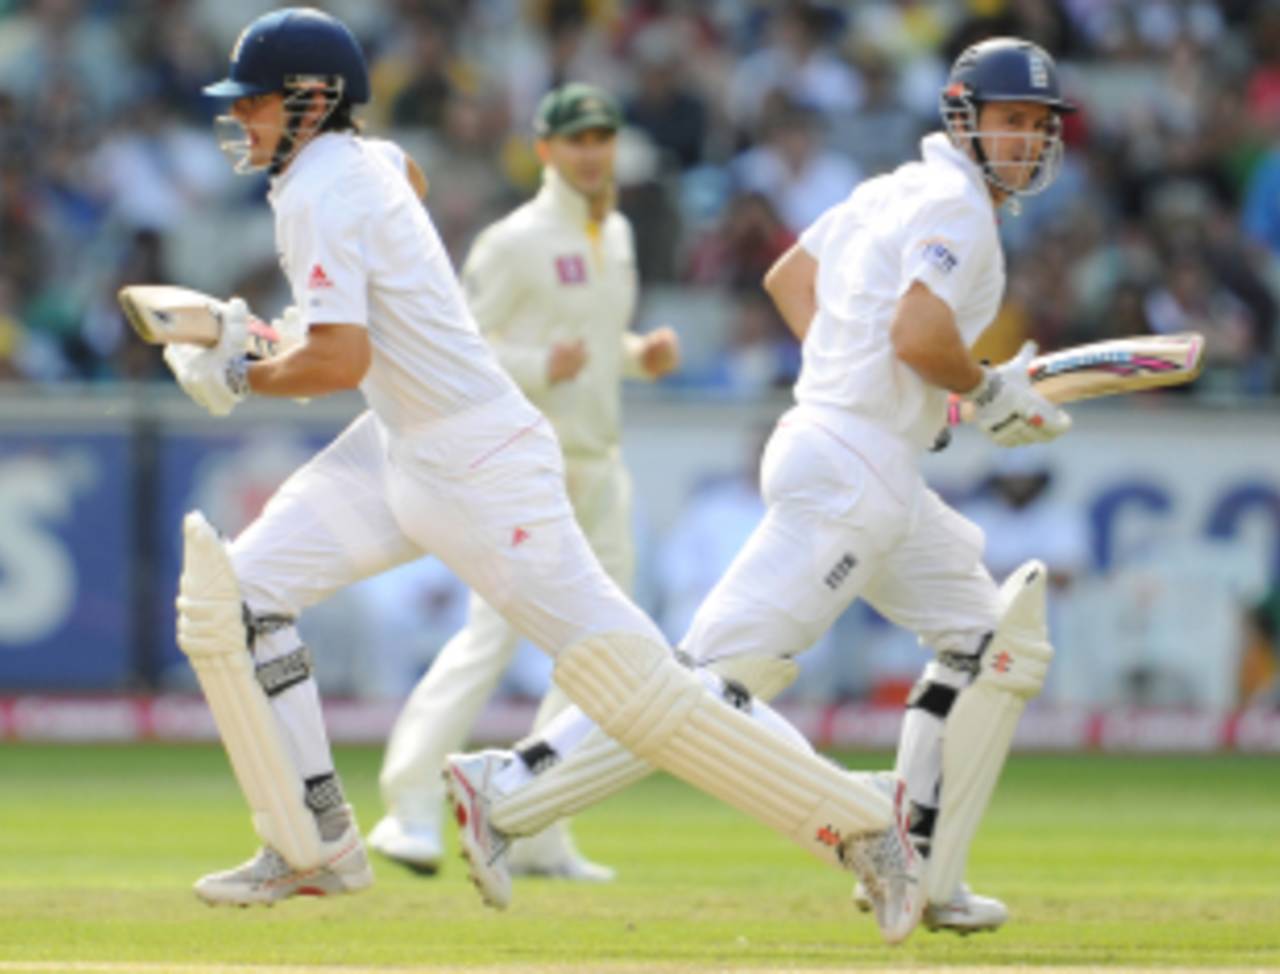
Alastair Cook and Andrew Strauss averaged more than 78 runs per opening partnership; their Australian counterparts didn't even manage half that number • Getty Images
In the end, the margin of victory was emphatic - a 3-1 series verdict, with all three wins by an innings, is more than what any England fan would have hoped for when the series began. After the Perth defeat, England were so much better than the hosts that the last two Tests were no-contests. The overall series numbers tell the story of a surprisingly one-sided contest.
- England averaged 51.14 runs per wicket, which their is highest ever in an Ashes contest. The only other instance when they averaged more than 50 was way back in 1926, in England, when they scored 50.63 runs per wicket. Their previous highest in Australia was 43.18 in 1928.
| Team | Runs scored | Wkts lost | Average | 100s/ 50s | Scoring rate | Bowling strike rate |
| England | 2864 | 56 | 51.14 | 9/ 11 | 3.50 | 56.73 |
| Australia | 2631 | 90 | 29.23 | 3/ 16 | 3.09 | 87.57 |
Throughout the series, Australia struggled with their top-order batting. Apart from Shane Watson and Michael Hussey, none of their specialist batsmen had series to remember. The contrast with England's batsmen is clear from the table below: while five of England's top seven averaged more than 50, Hussey was the only one to manage it for the hosts. Cook was clearly the standout player: his tally of 766 runs is fifth-highest in an Ashes series, and the second-best for England, while his series average of 127.67 is second only Don Bradman's 139.14 (among those who scored 500 runs in an Ashes series).
The only batting position where Australia completely outdid England was at the No.5 slot, where Paul Collingwood had five miserable Test matches. For Australia, on the other hand, there were no hundreds from the top four - compared to seven for England - while numbers three and four averaged less than 22. The repeated failures of Ricky Ponting and Michael Clarke were perhaps the biggest setbacks for Australia. Together, their No.3 and 4 batsmen had an aggregate of 364, which is Australia's lowest in a five-Test Ashes series since 1902. (Click here for Australia's batting and bowling averages, and here for England's.)
| Position | Eng - runs | Average | 100s/ 50s | Aus - runs | Average | 100s/ 50s |
| Openers | 1073 | 82.53 | 4/ 5 | 629 | 33.10 | 0/ 5 |
| No.3 | 445 | 89.00 | 2/ 1 | 171 | 19.00 | 0/ 1 |
| No.4 | 360 | 60.00 | 1/ 1 | 193 | 21.44 | 0/ 1 |
| No.5 | 77 | 12.83 | 0/ 0 | 570 | 63.33 | 2/ 3 |
| No.6 | 214 | 42.80 | 0/ 3 | 172 | 19.11 | 0/ 0 |
| No.7 | 255 | 51.00 | 1/ 1 | 396 | 56.57 | 1/ 4 |
It's more of the same story in the partnership stats too: England's average partnership for the top three wickets were all more than 70, which means they were seldom under early pressure. Australia's on the other hand, were all under 40 - with the third-wicket average less than 18 - which meant they were almost always under early pressure and forced to fight rearguard battles. Hussey and Haddin fought back on a few occasions, but when they couldn't, England were all over the hosts. England had five century partnerships for the first three wickets, compared to only one for Australia.
| Wicket | Eng - average | 100/ 50 stands | Aus - average | 100/ 50 stands |
| First | 78.42 | 2/ 2 | 36.90 | 0/ 4 |
| Second | 95.50 | 2/ 0 | 30.67 | 1/ 1 |
| Third | 71.16 | 1/ 3 | 17.67 | 0/ 1 |
| Fourth | 30.33 | 1/ 0 | 45.55 | 2/ 1 |
| Fifth | 40.33 | 1/ 1 | 30.88 | 0/ 2 |
| Sixth | 87.80 | 2/ 1 | 60.33 | 1/ 2 |
| Seventh | 33.20 | 1/ 0 | 10.55 | 0/ 1 |
| Eighth | 36.80 | 1/ 0 | 24.11 | 0/ 2 |
Perhaps the biggest difference between the two sides, though, was the quality of their pace attacks. Four of England's fast bowlers averaged less than 35, with their main man, James Anderson, conceding only 26.04 runs per wicket. In fact, Anderson's haul of 24 wickets is the highest by an England bowler in Australia since John Snow took 31 in six Tests in 1970.
Australia's pace attack, on the other hand, was toothless in comparison. Mitchell Johnson was their leading wicket-taker, but he conceded almost 37 runs per wicket. Leave out the Perth Test, in which he was admittedly outstanding, and his bowling average shoots up to 78.67. Similarly, Peter Siddle had 14 wickets for the series, but 12 of them came in two innings via two six-wicket hauls. Ben Hilfenhaus, the other fast bowler who played at least four Tests in the series, was Australia's most economical bowler, but also their most ineffective, requiring 135 deliveries per wicket.
The kind of scores the two teams put up is a good indication of the kind of bowling attack they were up against. Australia's batsmen were always under pressure, thanks to the ability of the England fast bowlers to find seam and swing even with an old Kookaburra ball. Australia's bowlers, though, hardly got the old ball to do anything, which made it much easier for England's batsmen to go on to big scores once they made starts. The only column where Australia lead is in five-fors, but that only means England shared the wickets around and all the bowlers contributed their bits.
Also, England had Graeme Swann to block an end up and take a few wickets - he had 15 at an average of less than 40. Australia's spinners, on the other hand, were an embarrassment.
| Overs | Wickets | Average | Strike rate | 5WI/ 10WM | |
| England - pace | 626.5 | 70 | 27.64 | 53.7 | 2/ 0 |
| Australia - pace | 631.1 | 51 | 40.96 | 74.2 | 4/ 0 |
| Aus pace, excl. Perth | 531.4 | 31 | 58.03 | 102.9 | 2/ 0 |
| England - spin | 224.1 | 16 | 38.31 | 84.0 | 1/ 0 |
| Australia - spin | 186.1 | 5 | 135.80 | 223.4 | 0/ 0 |
The head-to-head battles
Before the 2010 Ashes, Anderson had averaged 56.17 against Australia, with 17 wickets from eight Tests; in Australia he averaged 82.60 from three Tests. One of his biggest worries in the past had been Ponting, who'd completely owned him in previous contests, averaging 204 in the duel, and getting out only once in 280 balls. This time, though, the tables turned completely, with Anderson dismissing Ponting three times in 67 balls. Ponting's average - a miserable 9.67.
| Runs | Balls | Dismissals | Average | Run rate | |
| Before the 2010 Ashes | 204 | 280 | 1 | 204.00 | 4.37 |
| In the 2010 Ashes | 29 | 67 | 3 | 9.67 | 2.59 |
The two Australian batsmen who handled Anderson well were Hussey and Watson, who averaged more than 40 against him. Clarke, though, had no answers to Anderson and Chris Tremlett, falling to them five times at an average of less than ten.
| Batsman | Bowler(s) | Runs | Balls | Dismissals | Average |
| Michael Hussey | James Anderson | 112 | 215 | 1 | 112.00 |
| Shane Watson | James Anderson | 148 | 298 | 2 | 74.00 |
| Michael Clarke | Anderson & Tremlett | 44 | 130 | 5 | 8.80 |
Johnson had a largely forgettable series, but the one batsman he continued to dominate was Ian Bell - he dismissed Bell twice at an average of less than 20. In previous encounters, Bell had fallen to Johnson four times at an average of 9.25. Bell had no problems against Siddle, though, not falling to him even once in 126 balls, and scoring at nearly five runs per over.
| Batsman | Bowler | Runs | Balls | Dismissals | Average |
| Alastair Cook | Mitchell Johnson | 139 | 173 | 1 | 139.00 |
| Ian Bell | Mitchell Johnson | 39 | 106 | 2 | 19.50 |
| Ian Bell | Peter Siddle | 104 | 126 | 0 | - |
| Kevin Pietersen | Peter Siddle | 51 | 100 | 2 | 25.50 |
The final word in this series, though, must belong to Alastair Cook. The table below shows his head-to-head stats against each Australian bowler. His performance, more than any other, captures the English dominance in this Australian summer.
| Bowler | Runs | Balls | Dismissals | Average | Run rate |
| Mitchell Johnson | 139 | 173 | 1 | 139.00 | 4.82 |
| Ben Hilfenhaus | 121 | 286 | 0 | - | 2.53 |
| Xavier Doherty | 109 | 200 | 0 | - | 3.27 |
| Peter Siddle | 94 | 242 | 2 | 47.00 | 2.33 |
| Shane Watson | 86 | 172 | 1 | 86.00 | 3.00 |
| Ryan Harris | 68 | 124 | 2 | 34.00 | 3.29 |
S Rajesh is stats editor of Cricinfo